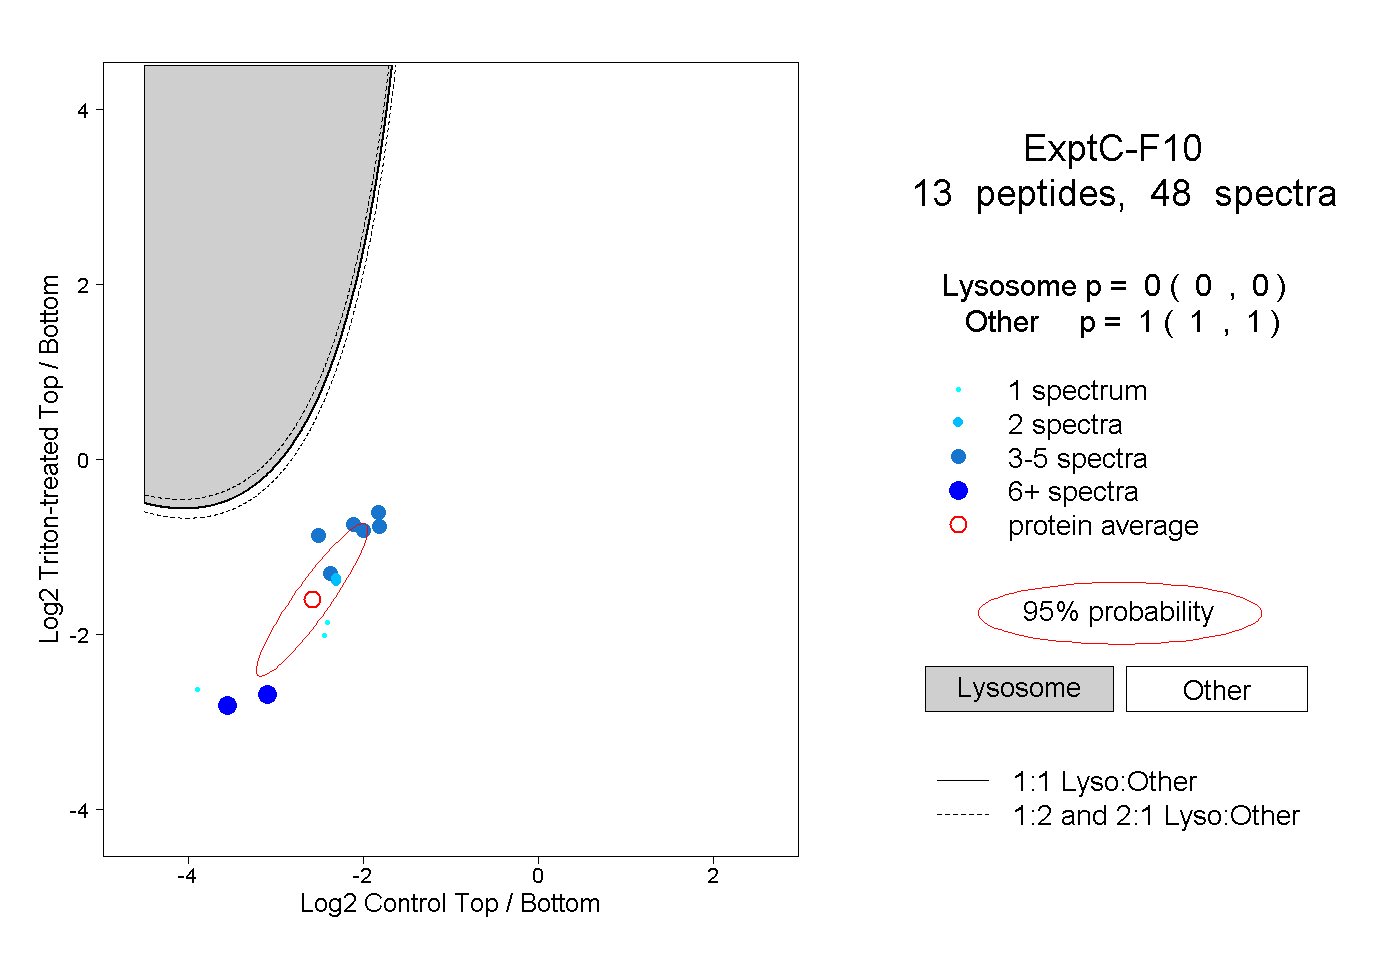
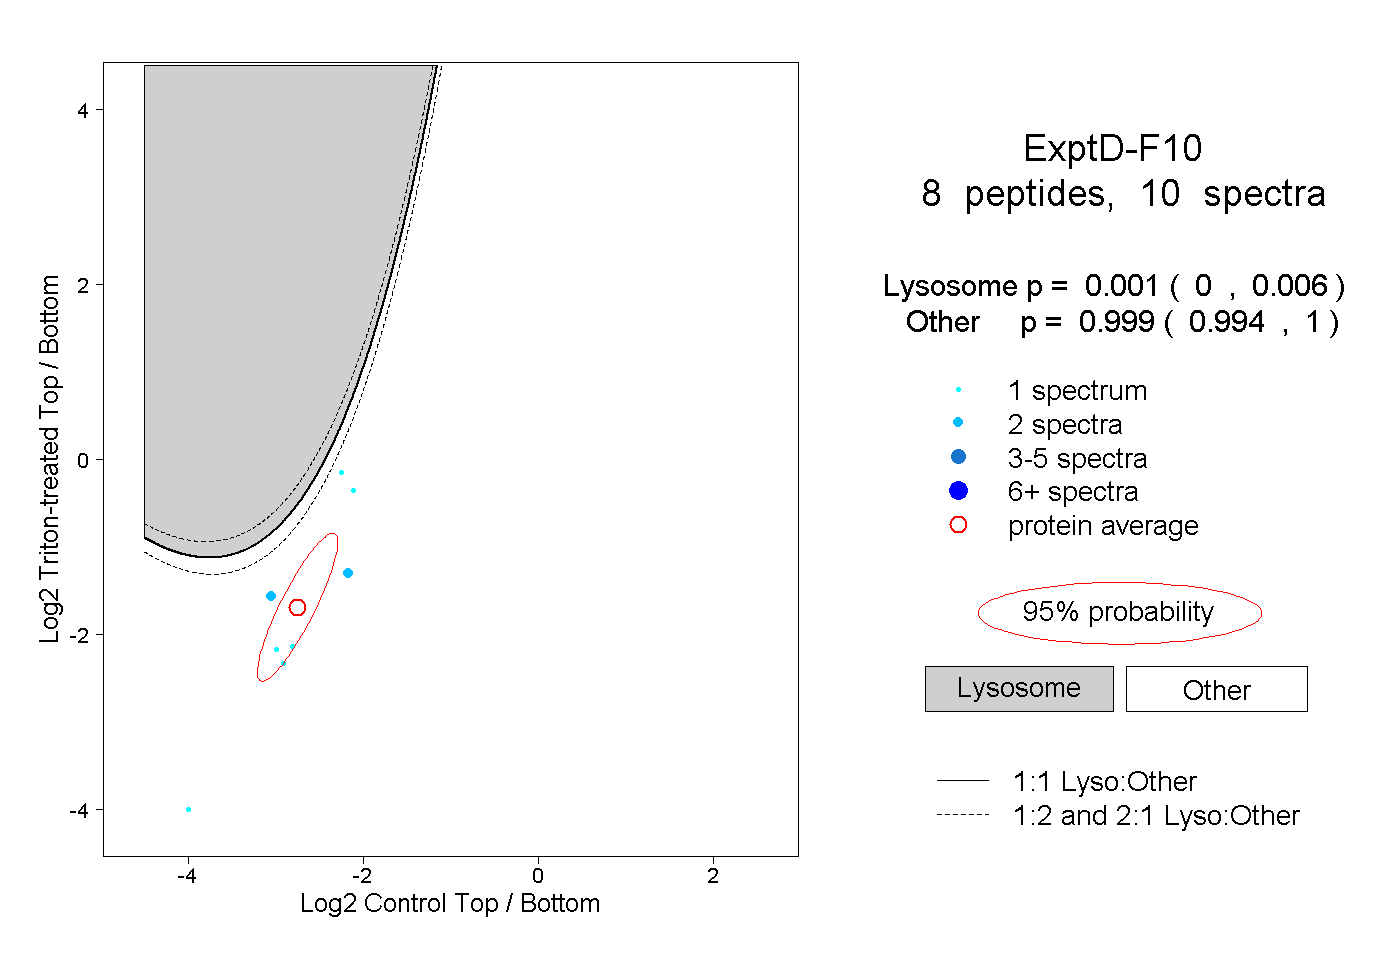
F10
[ENSRNOP00000026677]
Main page
| | | Plot |
Mito |
Lyso |
|
Perox |
ER |
Golgi |
PM |
Cytosol |
Nucleus |
|
| Expt A |
 15
15
peptides |
36
spectra |
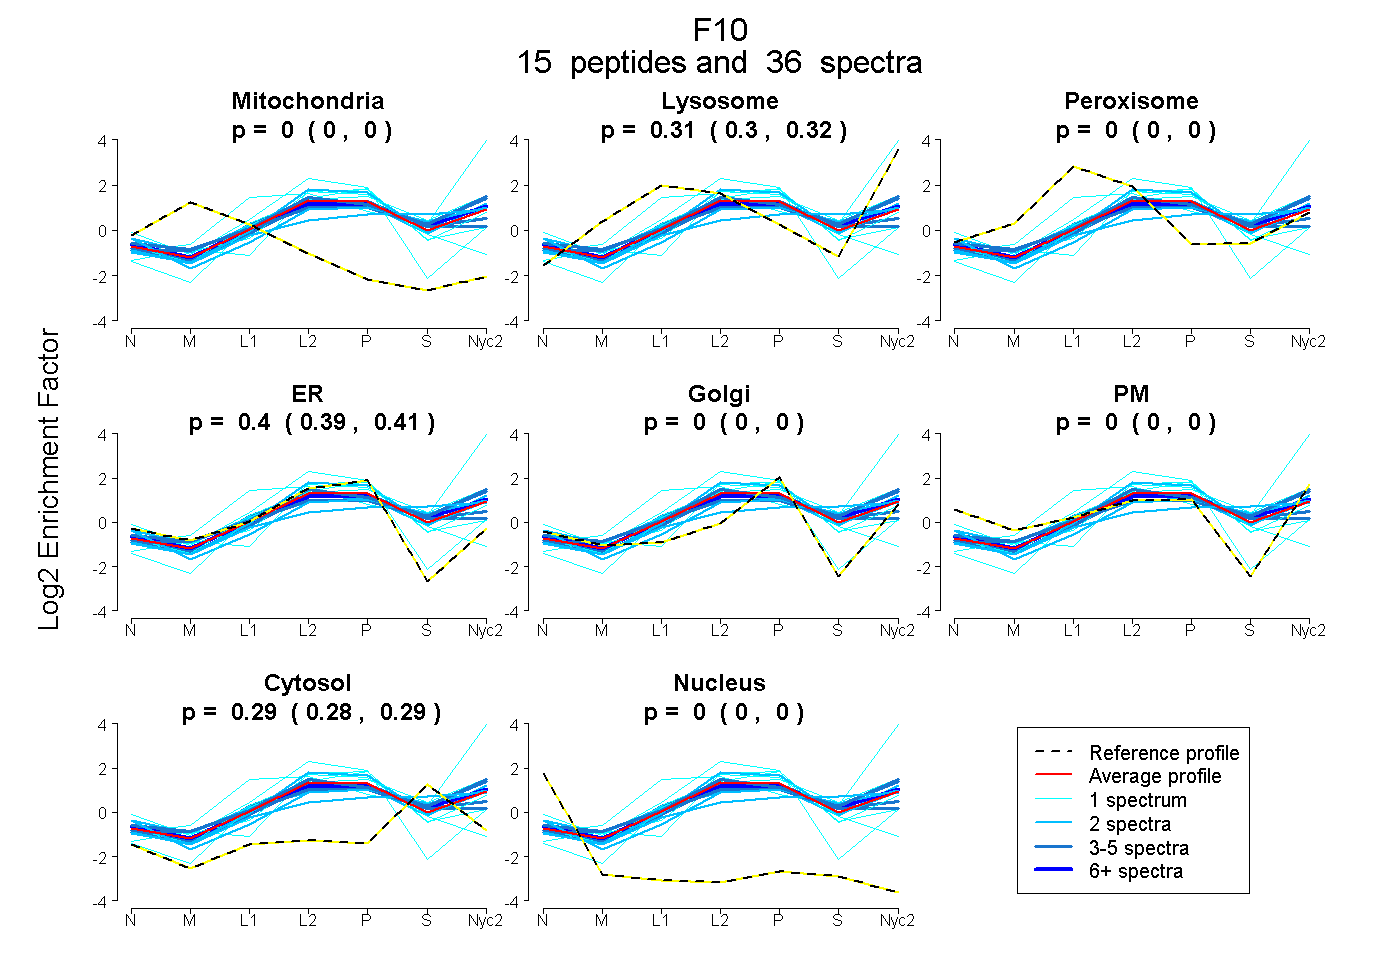 |
0.000
0.000 | 0.000 |
0.310
0.295 | 0.322 |
|
0.000
0.000 | 0.000 |
0.402
0.389 | 0.413 |
0.000
0.000 | 0.000 |
0.000
0.000 | 0.000 |
0.288
0.281 | 0.294 |
0.000
0.000 | 0.000 |
|
| | | Plot |
Mito |
|
Lyso or Perox |
|
ER |
Golgi |
PM |
Cytosol |
Nucleus |
|
| Expt B |
2
peptides |
3
spectra |
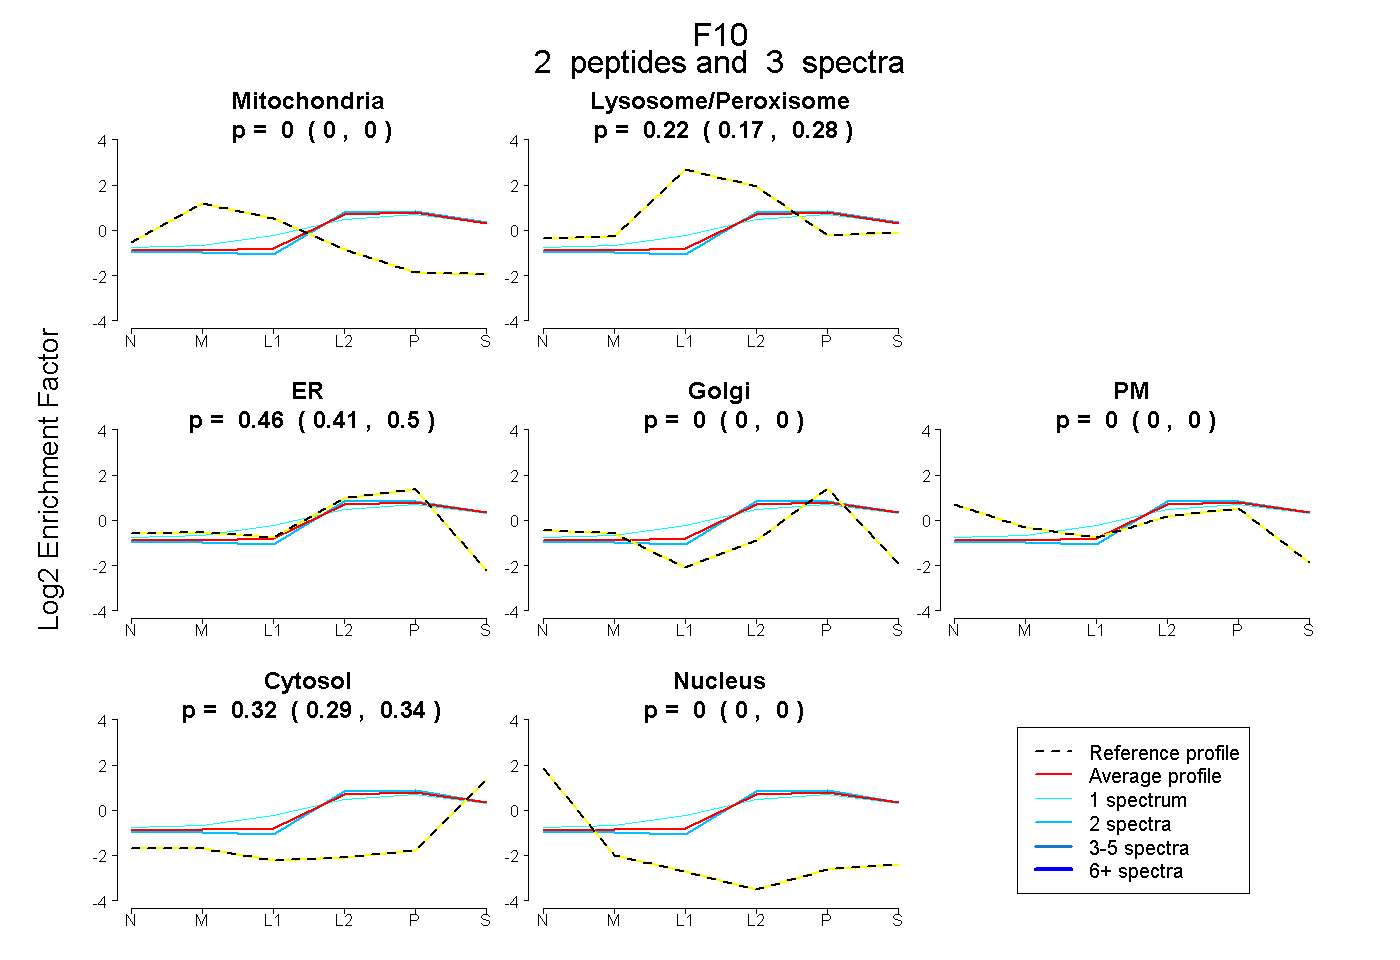 |
0.000
0.000 | 0.000 |
|
0.222
0.165 | 0.275 |
|
0.462
0.410 | 0.496 |
0.000
0.000 | 0.000 |
0.000
0.000 | 0.000 |
0.316
0.291 | 0.335 |
0.000
0.000 | 0.000 |
|
| | | Plot |
|
Lyso |
|
|
|
|
|
|
|
Other |
| Expt C |
13
peptides |
48
spectra |
 |
|
0.000
0.000 | 0.000 |
|
|
|
|
|
|
|
1.000
1.000 | 1.000 |
| | | Plot |
|
Lyso |
|
|
|
|
|
|
|
Other |
| Expt D |
8
peptides |
10
spectra |
 |
|
0.001
0.000 | 0.006 |
|
|
|
|
|
|
|
0.999
0.994 | 1.000 |
| 1 spectrum, DWAEATLMTQK |
|
0.000 |
|
|
|
|
|
|
|
1.000 |
| 1 spectrum, EEQNSVVCSCAK |
|
0.000 |
|
|
|
|
|
|
|
1.000 |
| 2 spectra, VTAFLK |
|
0.000 |
|
|
|
|
|
|
|
1.000 |
| 1 spectrum, SCLSTAPFPCGK |
|
0.050 |
|
|
|
|
|
|
|
0.950 |
| 2 spectra, TEPEANSDDVIR |
|
0.010 |
|
|
|
|
|
|
|
0.990 |
| 1 spectrum, VGPTSETPR |
|
0.000 |
|
|
|
|
|
|
|
1.000 |
| 1 spectrum, NCELFVR |
|
0.000 |
|
|
|
|
|
|
|
1.000 |
| 1 spectrum, TPITFR |
|
0.003 |
|
|
|
|
|
|
|
0.997 |