 10
10peptides
spectra
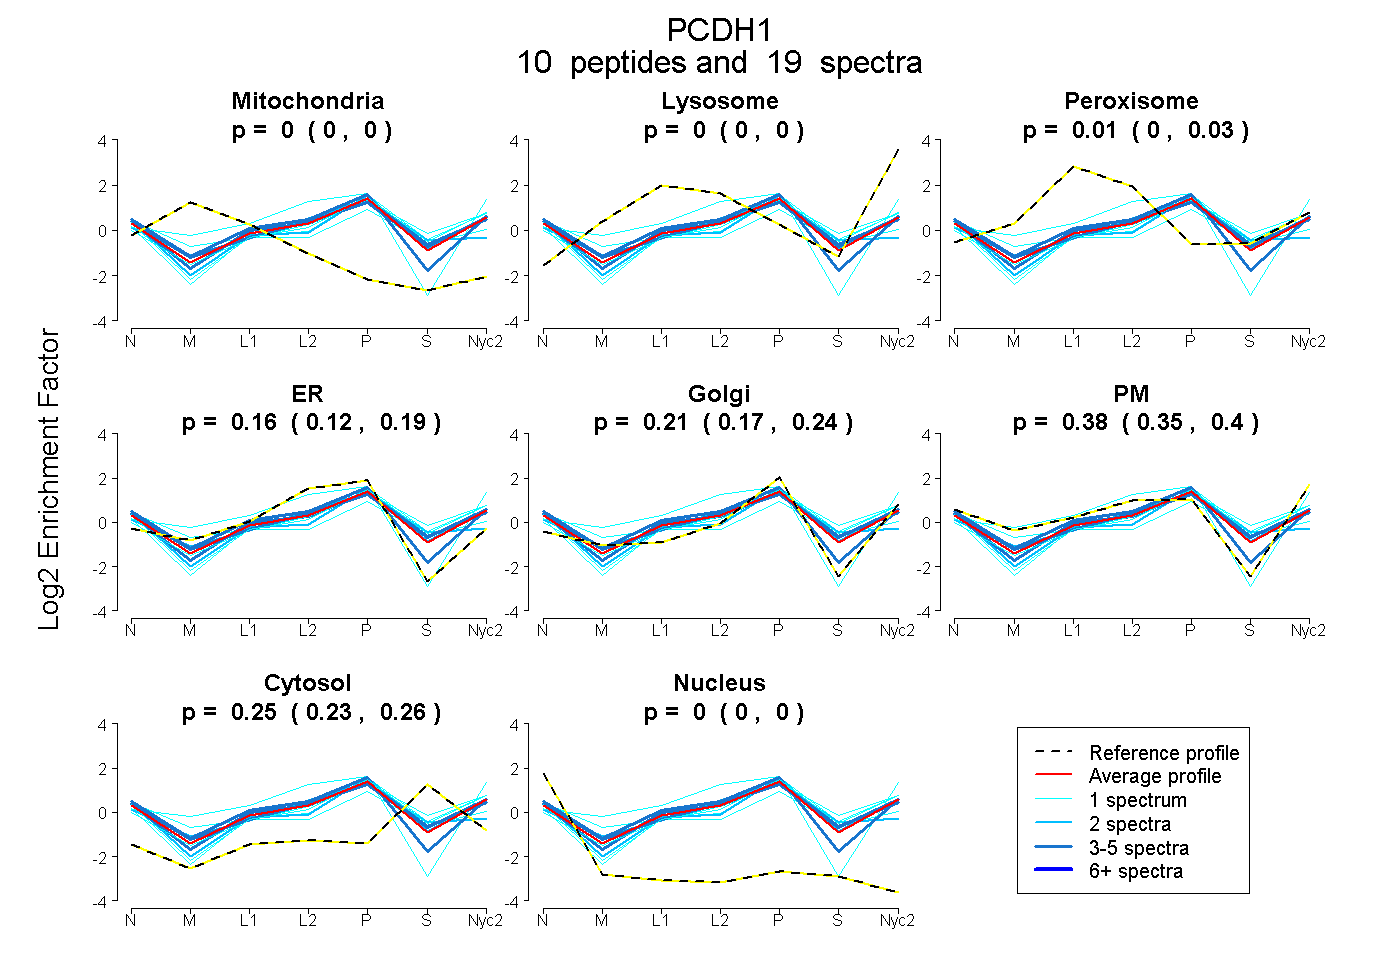
0.000 | 0.000
0.000 | 0.000
0.000 | 0.032
0.117 | 0.189
0.166 | 0.243
0.347 | 0.399
0.232 | 0.256
0.000 | 0.000
3peptides
spectra
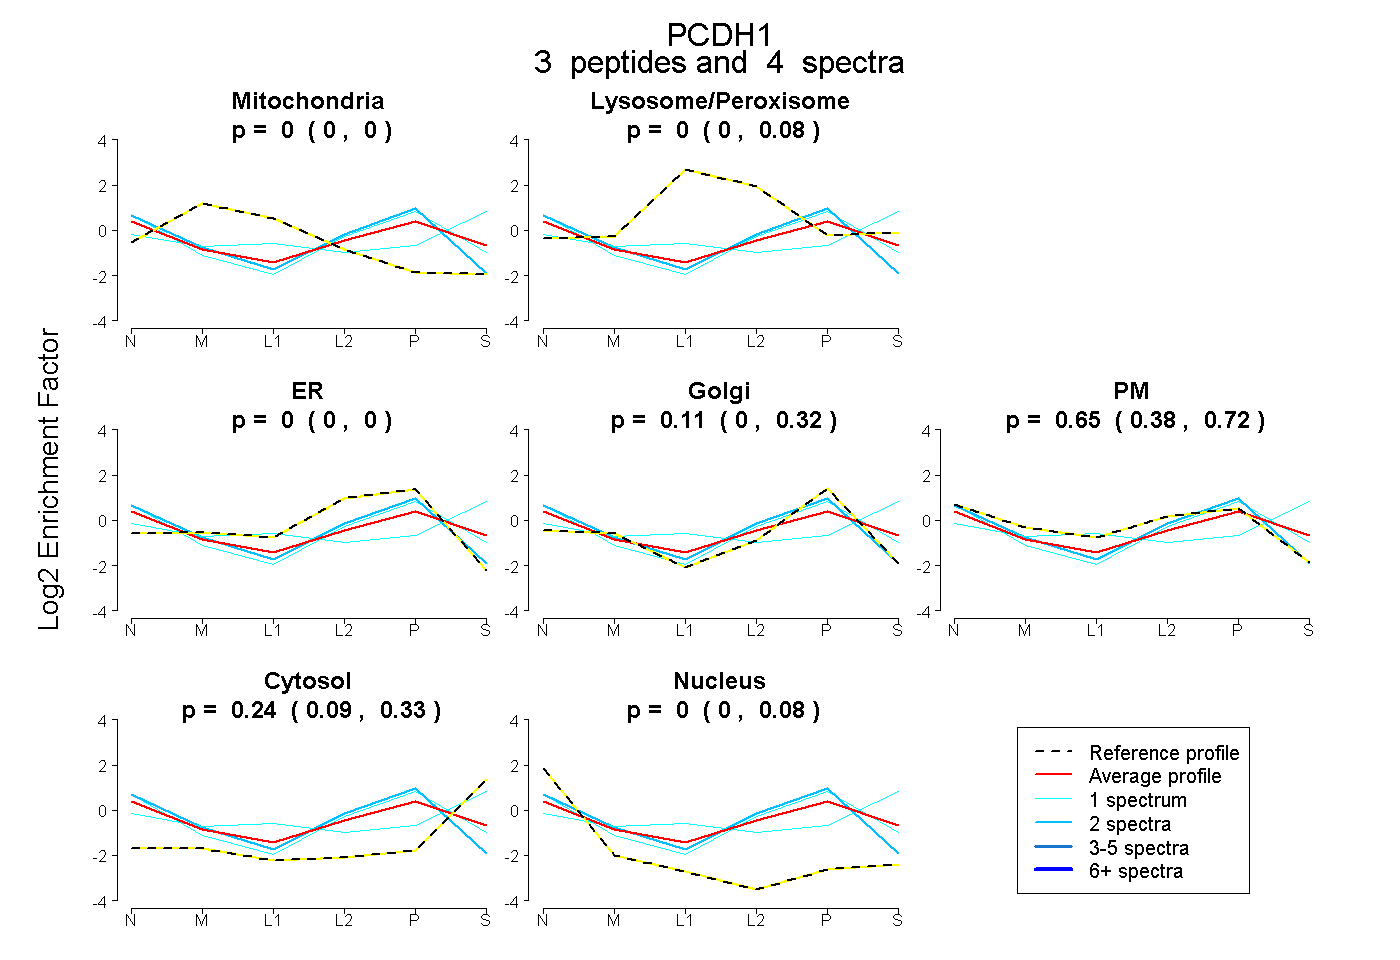
0.000 | 0.000
0.000 | 0.083
0.000 | 0.000
0.000 | 0.320
0.379 | 0.723
0.089 | 0.334
0.000 | 0.079
15peptides
spectra
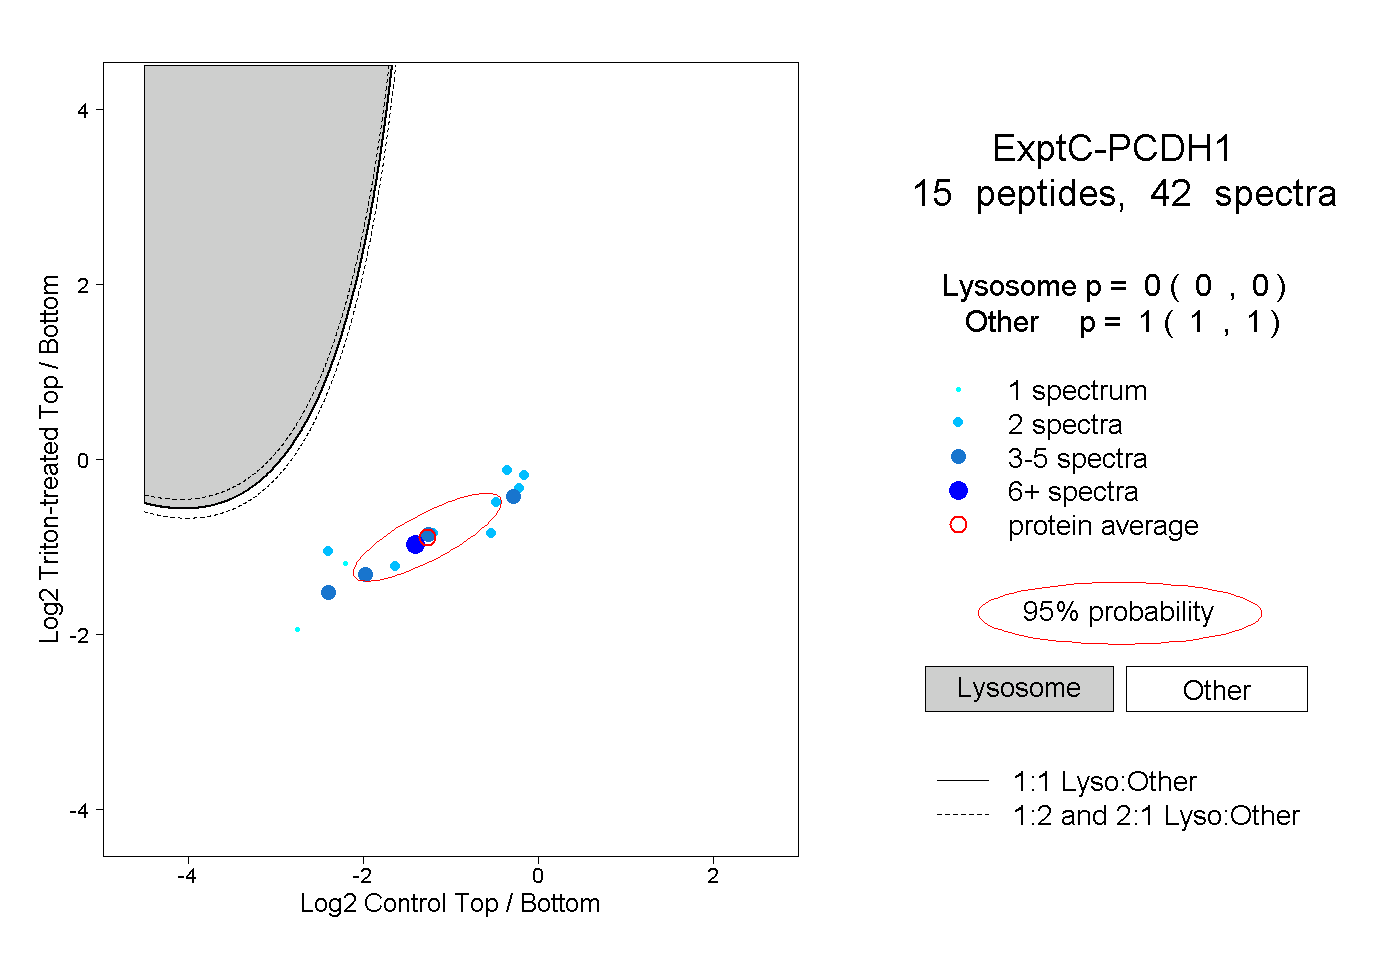
0.000 | 0.000
1.000 | 1.000
2peptides
spectra
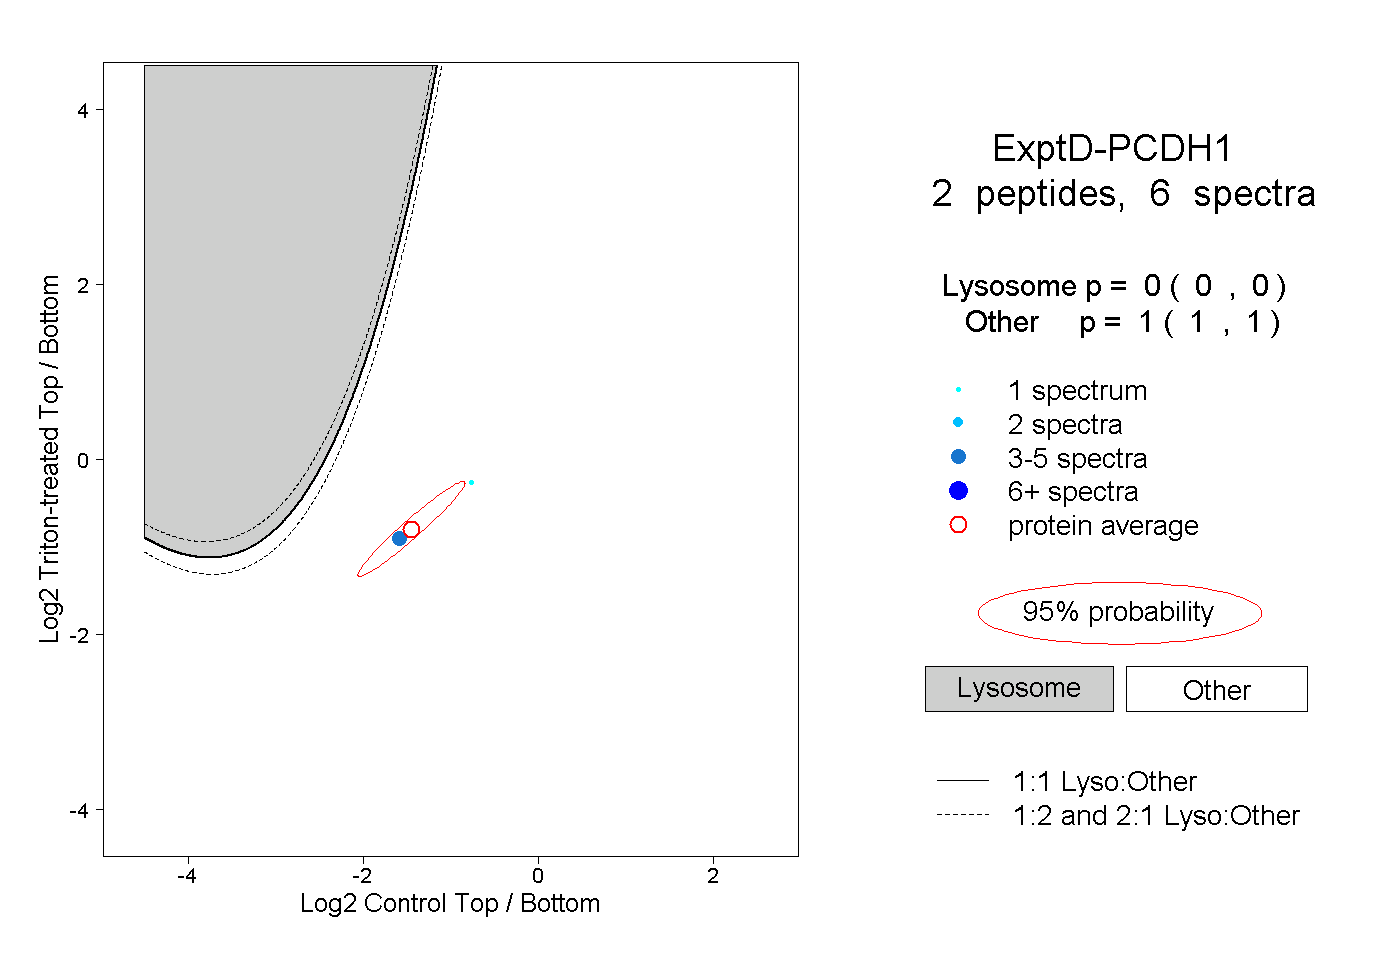
0.000 | 0.000
1.000 | 1.000