 10
10peptides
spectra
0.000 | 0.000
0.000 | 0.000
0.000 | 0.032
0.117 | 0.189
0.166 | 0.243
0.347 | 0.399
0.232 | 0.256
0.000 | 0.000
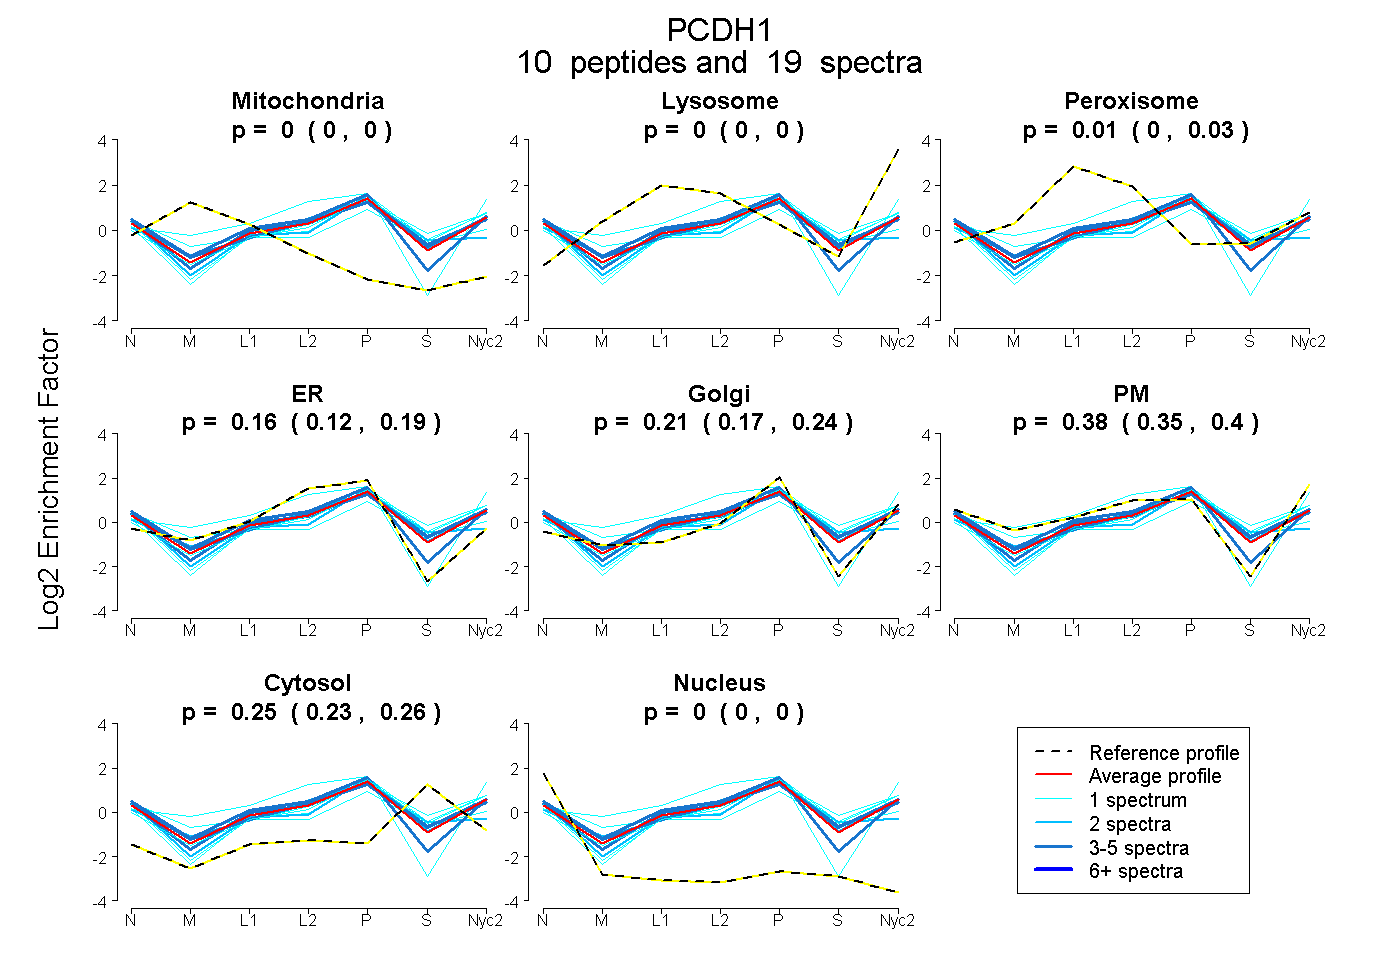
| Plot | Mito | Lyso | Perox | ER | Golgi | PM | Cytosol | Nucleus | |||||
| Expt A |
10 peptides |
19 spectra |
|
0.000 0.000 | 0.000 |
0.000 0.000 | 0.000 |
0.014 0.000 | 0.032 |
0.158 0.117 | 0.189 |
0.206 0.166 | 0.243 |
0.377 0.347 | 0.399 |
0.245 0.232 | 0.256 |
0.000 0.000 | 0.000 |
| 1 spectrum, VQDGGSPPR | 0.000 | 0.000 | 0.000 | 0.015 | 0.327 | 0.346 | 0.312 | 0.000 | ||
| 1 spectrum, FNLMSDAPGDSPR | 0.000 | 0.050 | 0.000 | 0.309 | 0.000 | 0.642 | 0.000 | 0.000 | ||
| 2 spectra, DSYELK | 0.000 | 0.000 | 0.000 | 0.031 | 0.409 | 0.296 | 0.264 | 0.000 | ||
| 1 spectrum, QPQLIVMGNLDR | 0.000 | 0.013 | 0.083 | 0.000 | 0.346 | 0.250 | 0.308 | 0.000 | ||
| 3 spectra, TGDIFTTETSIDR | 0.000 | 0.000 | 0.000 | 0.154 | 0.094 | 0.472 | 0.279 | 0.000 | ||
| 4 spectra, LEVGAPYLR | 0.000 | 0.000 | 0.019 | 0.196 | 0.131 | 0.362 | 0.293 | 0.000 | ||
| 1 spectrum, FSVLAK | 0.000 | 0.000 | 0.141 | 0.000 | 0.344 | 0.216 | 0.246 | 0.052 | ||
| 3 spectra, LLTPQTR | 0.000 | 0.000 | 0.000 | 0.269 | 0.178 | 0.440 | 0.105 | 0.008 | ||
| 2 spectra, EQQSTYTFQLK | 0.000 | 0.000 | 0.018 | 0.504 | 0.018 | 0.132 | 0.328 | 0.000 | ||
| 1 spectrum, DMNDNAPTIEIR | 0.000 | 0.000 | 0.000 | 0.000 | 0.411 | 0.265 | 0.324 | 0.000 |
| Plot | Mito | Lyso or Perox | ER | Golgi | PM | Cytosol | Nucleus | ||||||
| Expt B |
3 peptides |
4 spectra |
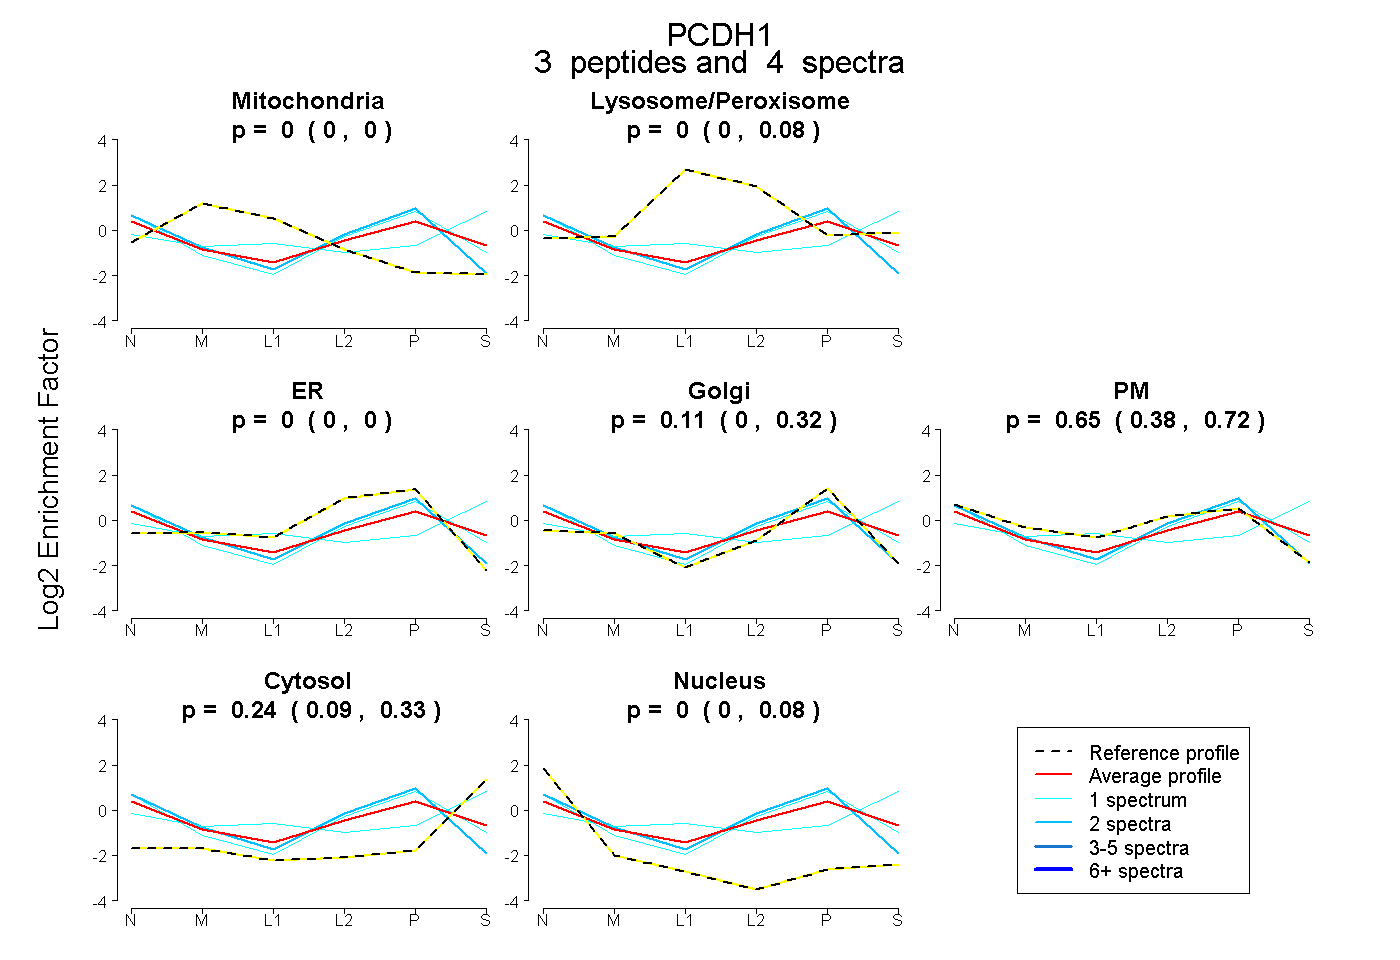 |
0.000 0.000 | 0.000 |
0.000 0.000 | 0.083 |
0.000 0.000 | 0.000 |
0.111 0.000 | 0.320 |
0.647 0.379 | 0.723 |
0.242 0.089 | 0.334 |
0.000 0.000 | 0.079 |
|||
| Plot | Lyso | Other | |||||||||||
| Expt C |
15 peptides |
42 spectra |
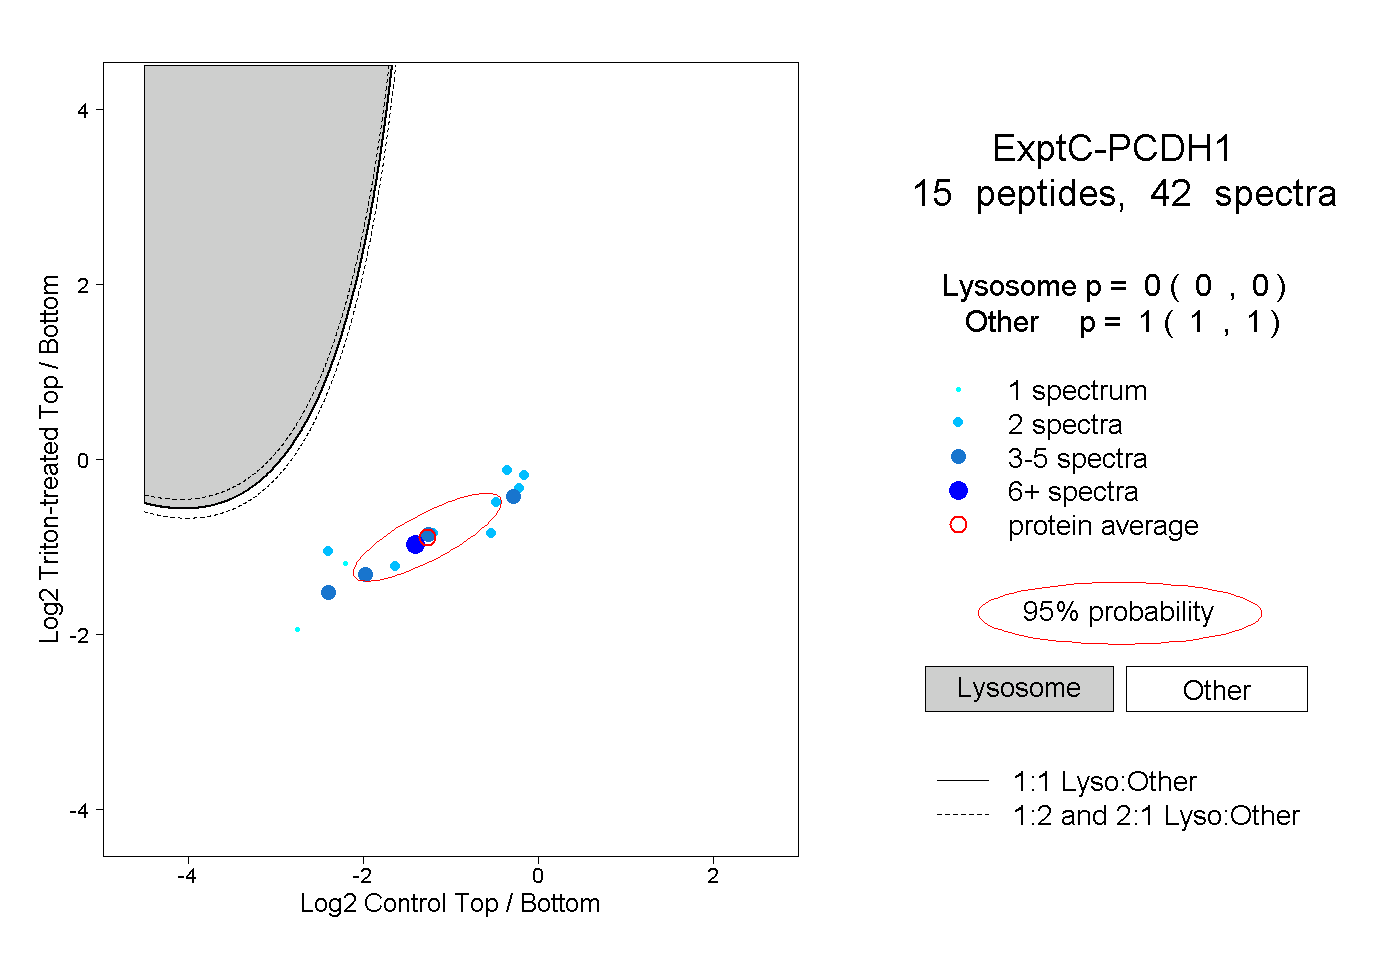 |
0.000 0.000 | 0.000 |
1.000 1.000 | 1.000 |
||||||||
| Plot | Lyso | Other | |||||||||||
| Expt D |
2 peptides |
6 spectra |
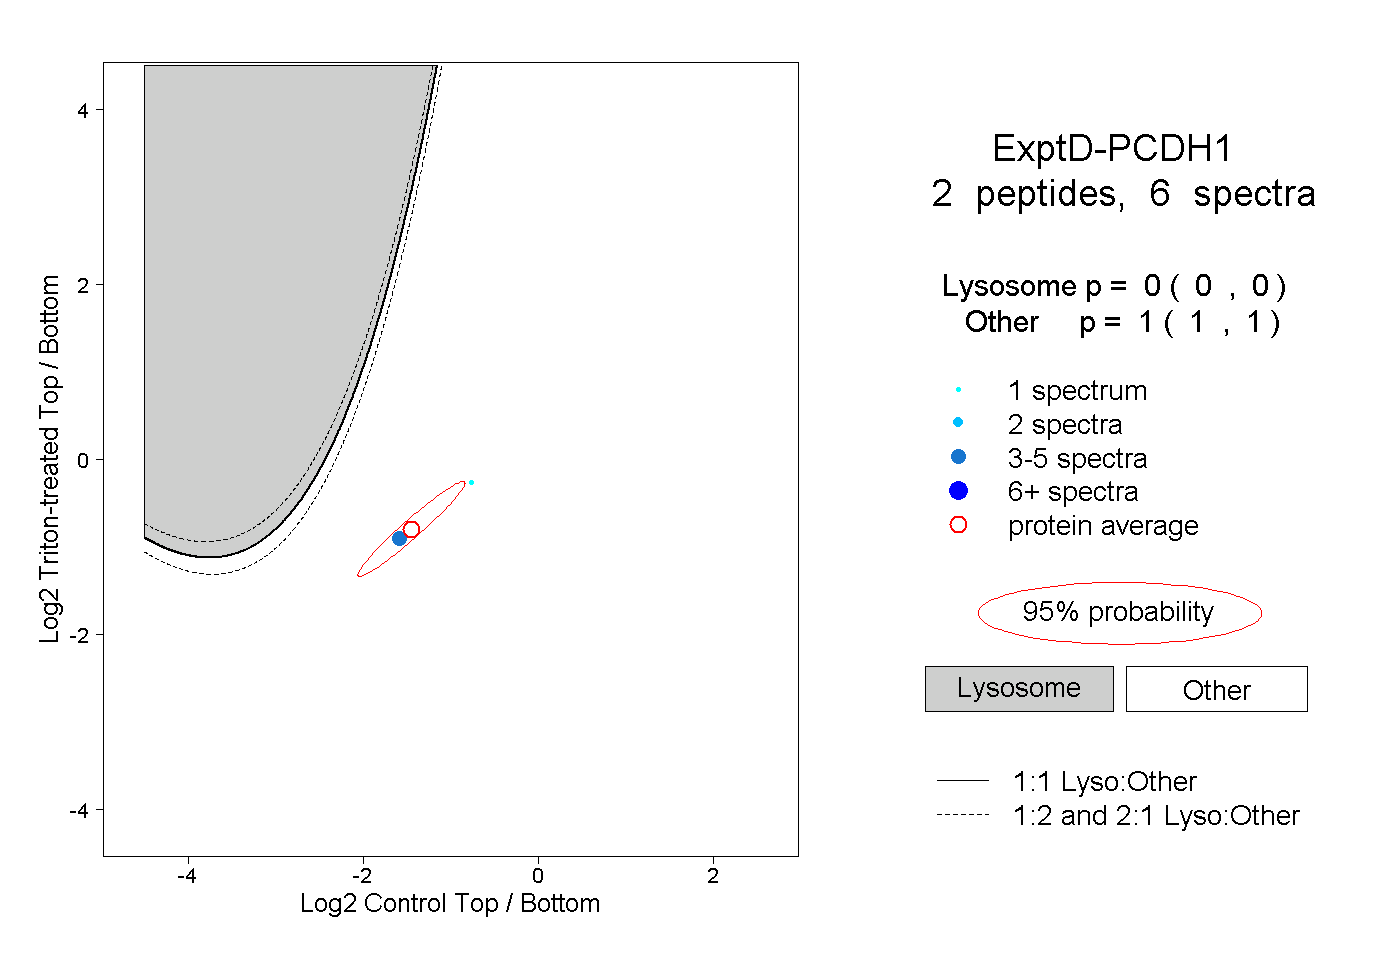 |
0.000 0.000 | 0.000 |
1.000 1.000 | 1.000 |