PCDH1
[ENSRNOP00000026324]
Main page
| | | Plot |
Mito |
Lyso |
|
Perox |
ER |
Golgi |
PM |
Cytosol |
Nucleus |
|
| Expt A |
 10
10
peptides |
19
spectra |
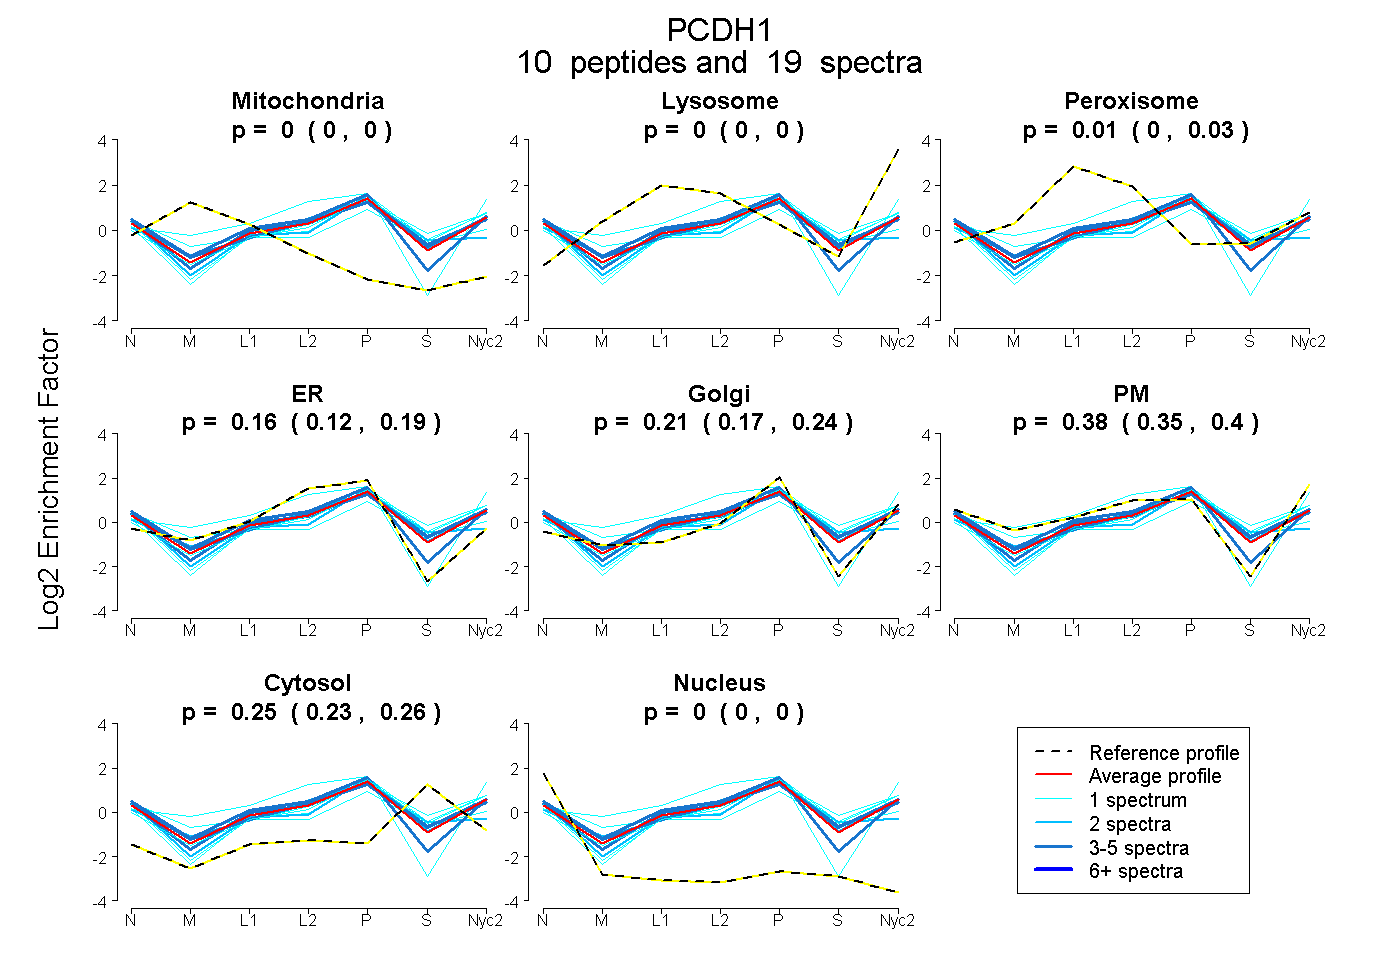 |
0.000
0.000 | 0.000 |
0.000
0.000 | 0.000 |
|
0.014
0.000 | 0.032 |
0.158
0.117 | 0.189 |
0.206
0.166 | 0.243 |
0.377
0.347 | 0.399 |
0.245
0.232 | 0.256 |
0.000
0.000 | 0.000 |
|
| | | Plot |
Mito |
|
Lyso or Perox |
|
ER |
Golgi |
PM |
Cytosol |
Nucleus |
|
| Expt B |
3
peptides |
4
spectra |
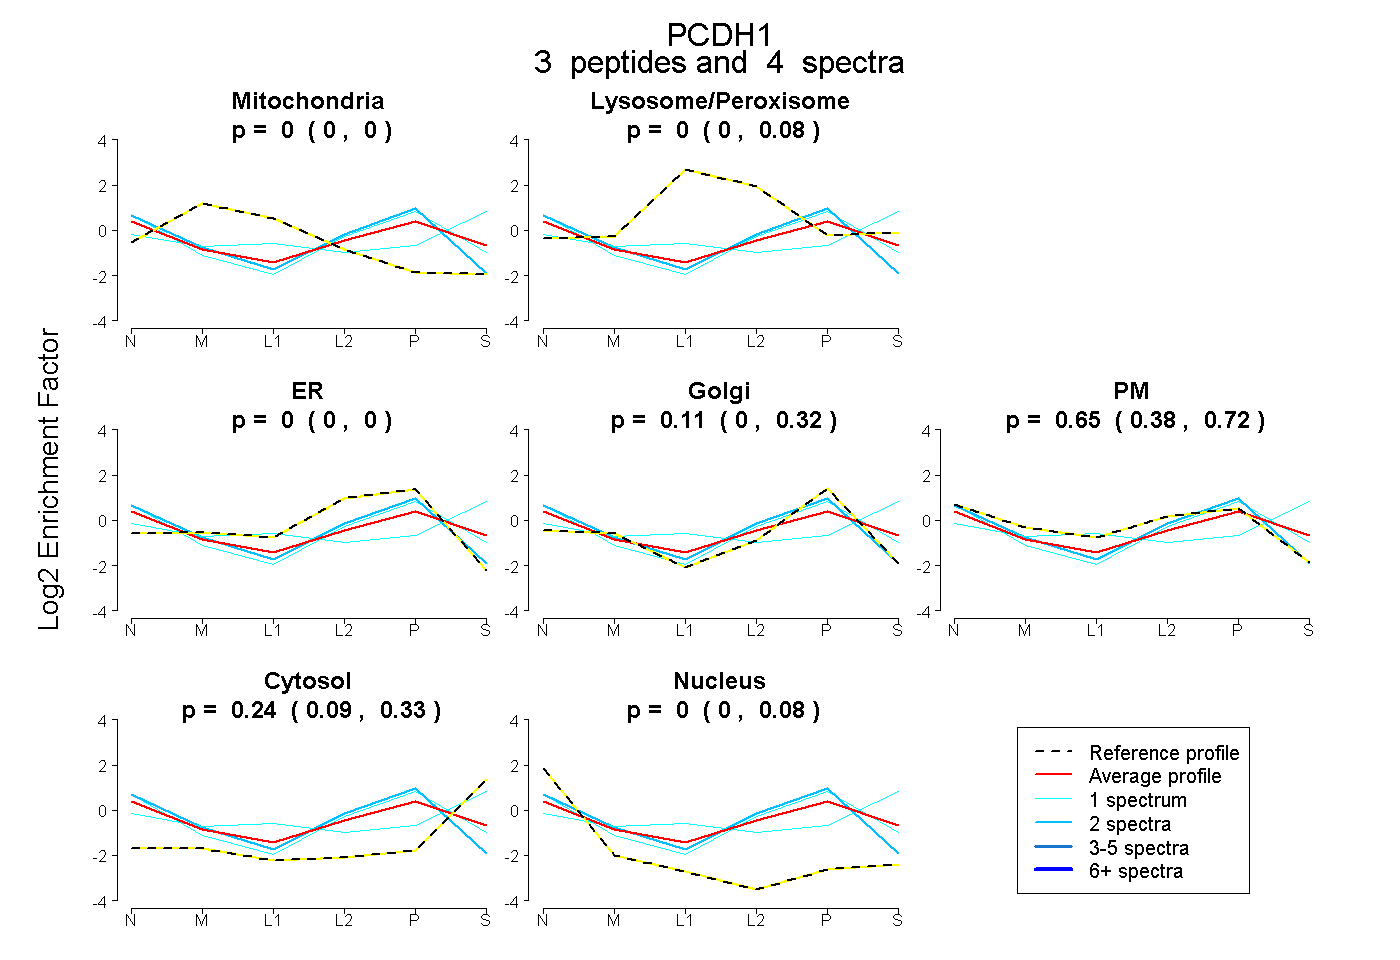 |
0.000
0.000 | 0.000 |
|
0.000
0.000 | 0.083 |
|
0.000
0.000 | 0.000 |
0.111
0.000 | 0.320 |
0.647
0.379 | 0.723 |
0.242
0.089 | 0.334 |
0.000
0.000 | 0.079 |
|
| 2 spectra, LLTPQTR |
0.000 |
|
0.000 |
|
0.000 |
0.410 |
0.552 |
0.000 |
0.039 |
|
| 1 spectrum, VTVLDTNDNAPK |
0.000 |
|
0.259 |
|
0.000 |
0.000 |
0.199 |
0.512 |
0.031 |
|
| 1 spectrum, LEVGAPYLR |
0.000 |
|
0.000 |
|
0.000 |
0.354 |
0.501 |
0.118 |
0.028 |
|
| | | Plot |
|
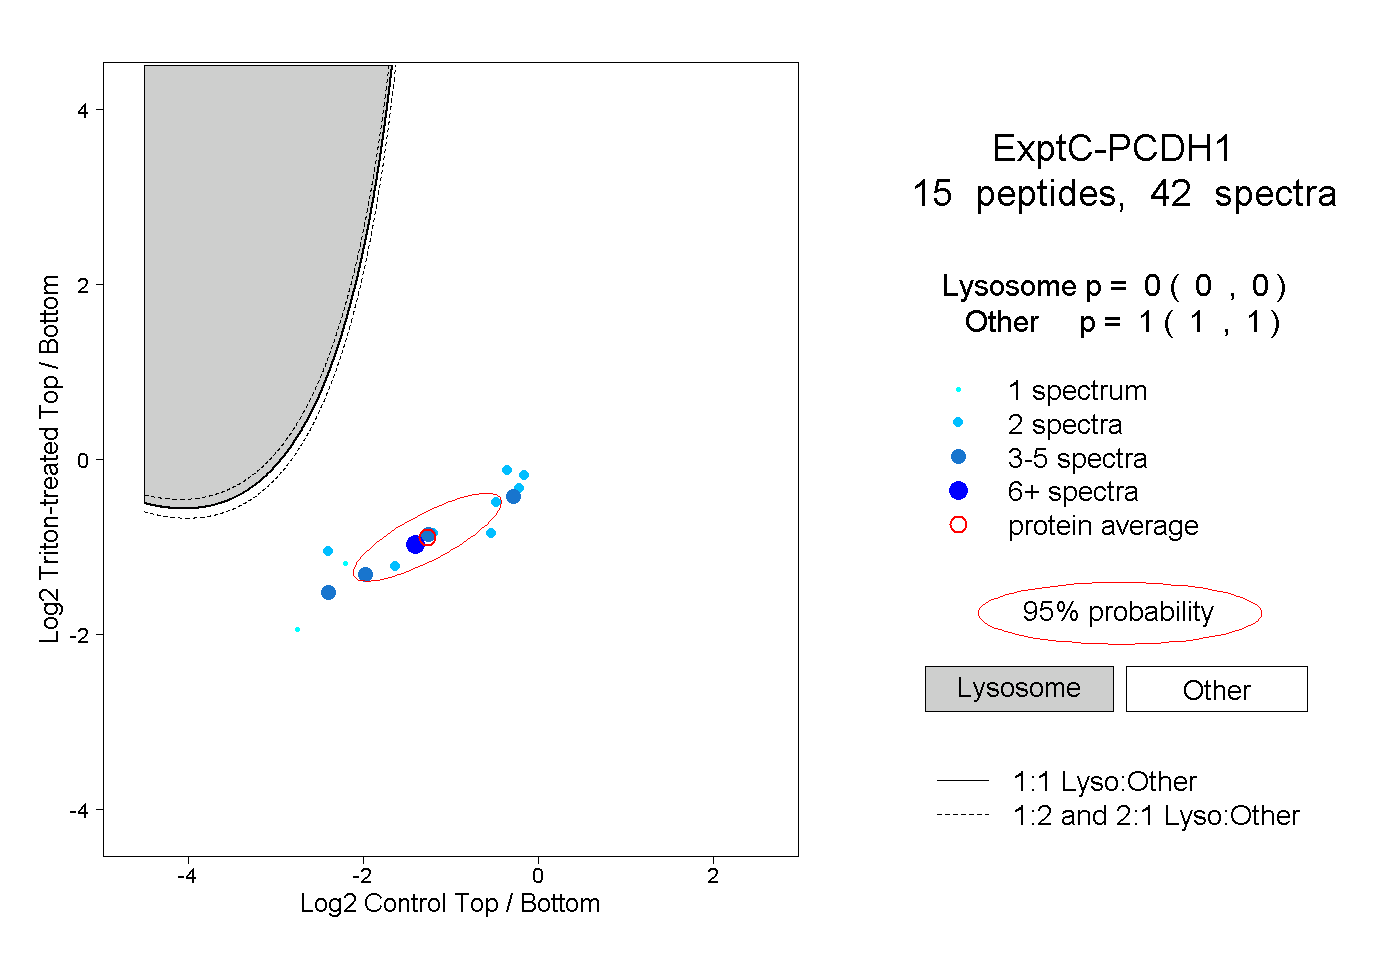
Lyso |
|
|
|
|
|
|
|
Other |
| Expt C |
15
peptides |
42
spectra |
 |
|
0.000
0.000 | 0.000 |
|
|
|
|
|
|
|
1.000
1.000 | 1.000 |
| | | Plot |
|
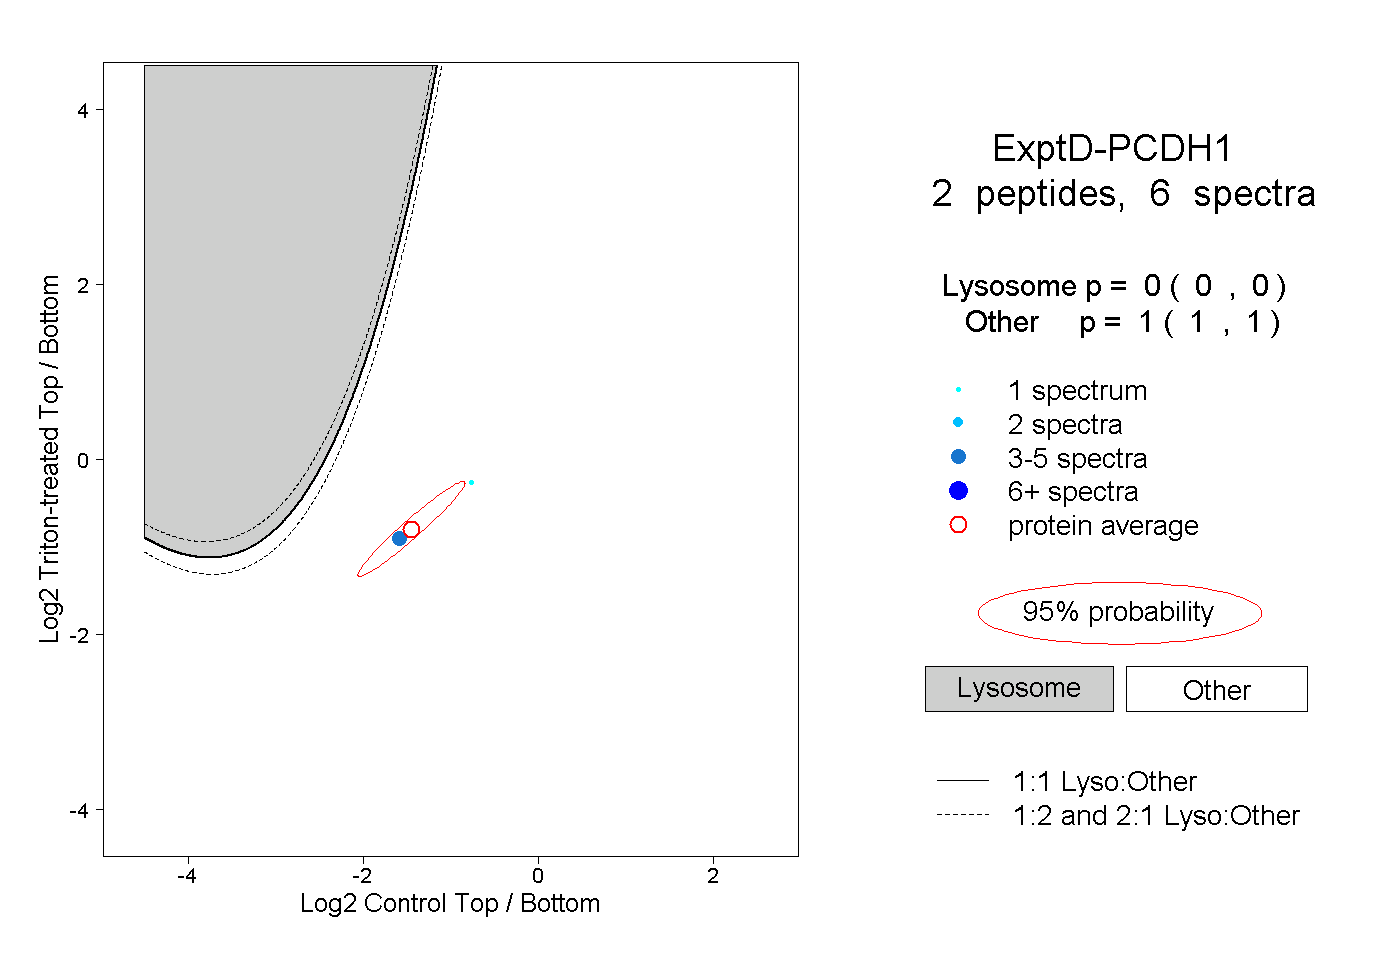
Lyso |
|
|
|
|
|
|
|
Other |
| Expt D |
2
peptides |
6
spectra |
 |
|
0.000
0.000 | 0.000 |
|
|
|
|
|
|
|
1.000
1.000 | 1.000 |