 13
13peptides
spectra
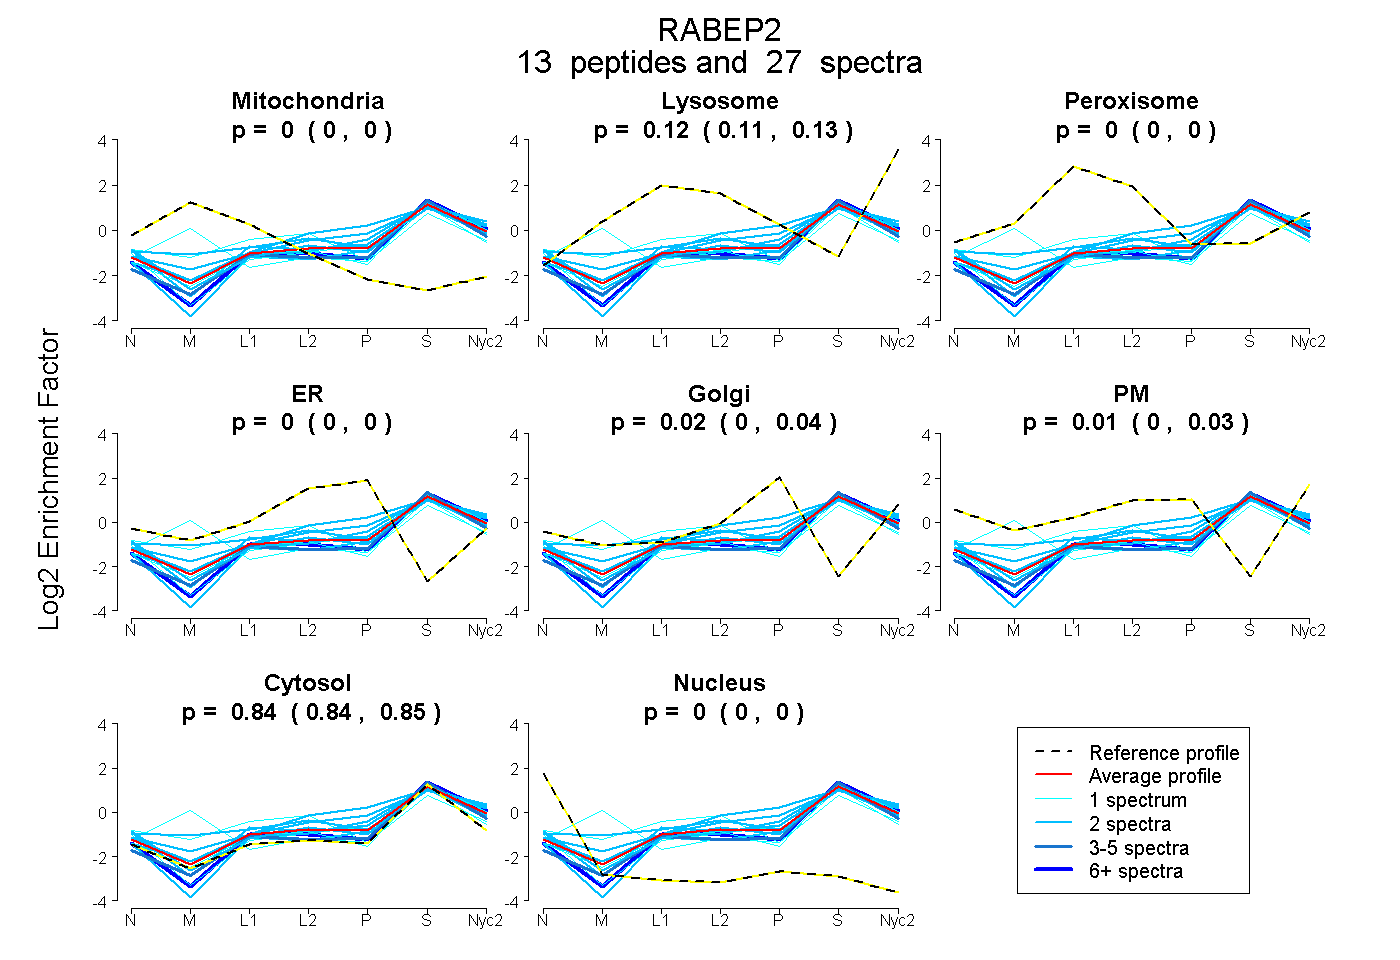
0.000 | 0.000
0.111 | 0.129
0.000 | 0.000
0.000 | 0.000
0.003 | 0.038
0.000 | 0.029
0.836 | 0.851
0.000 | 0.000
3peptides
spectra
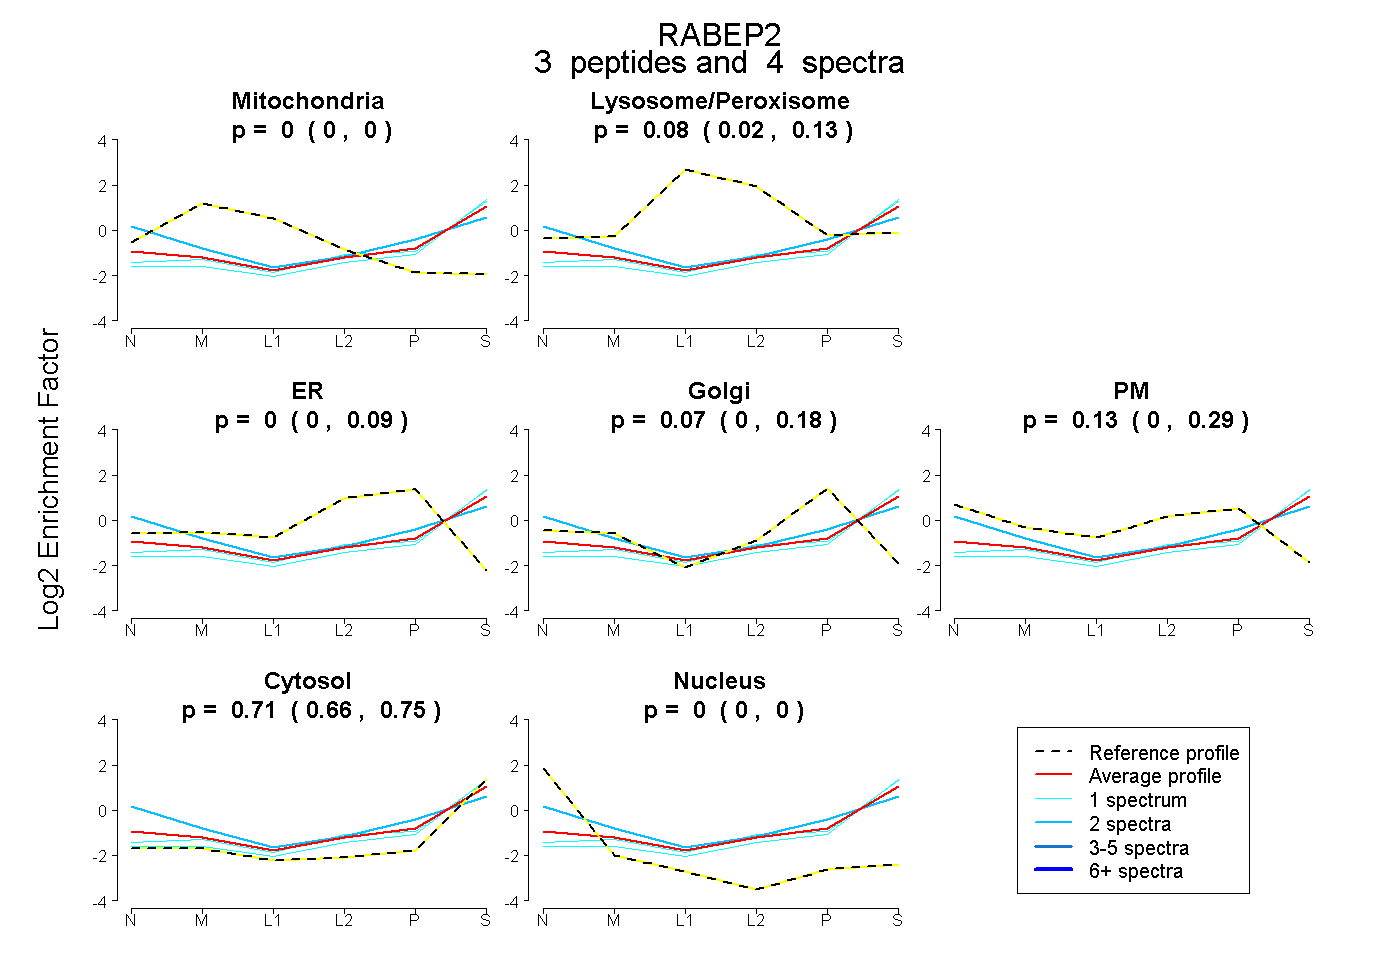
0.000 | 0.000
0.019 | 0.131
0.000 | 0.086
0.000 | 0.181
0.000 | 0.291
0.660 | 0.754
0.000 | 0.000
11peptides
spectra
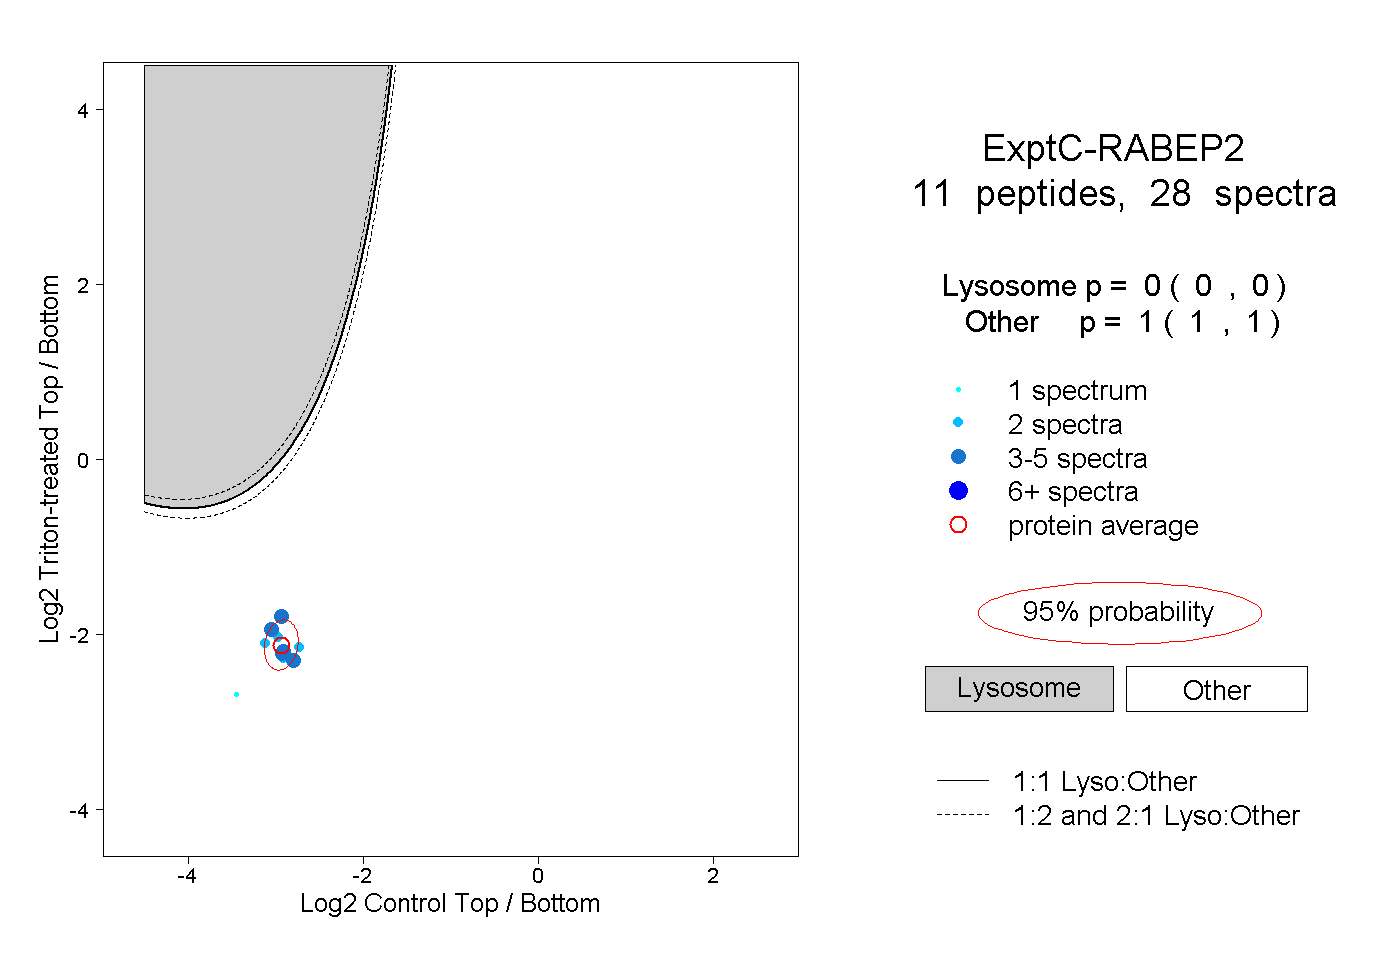
0.000 | 0.000
1.000 | 1.000