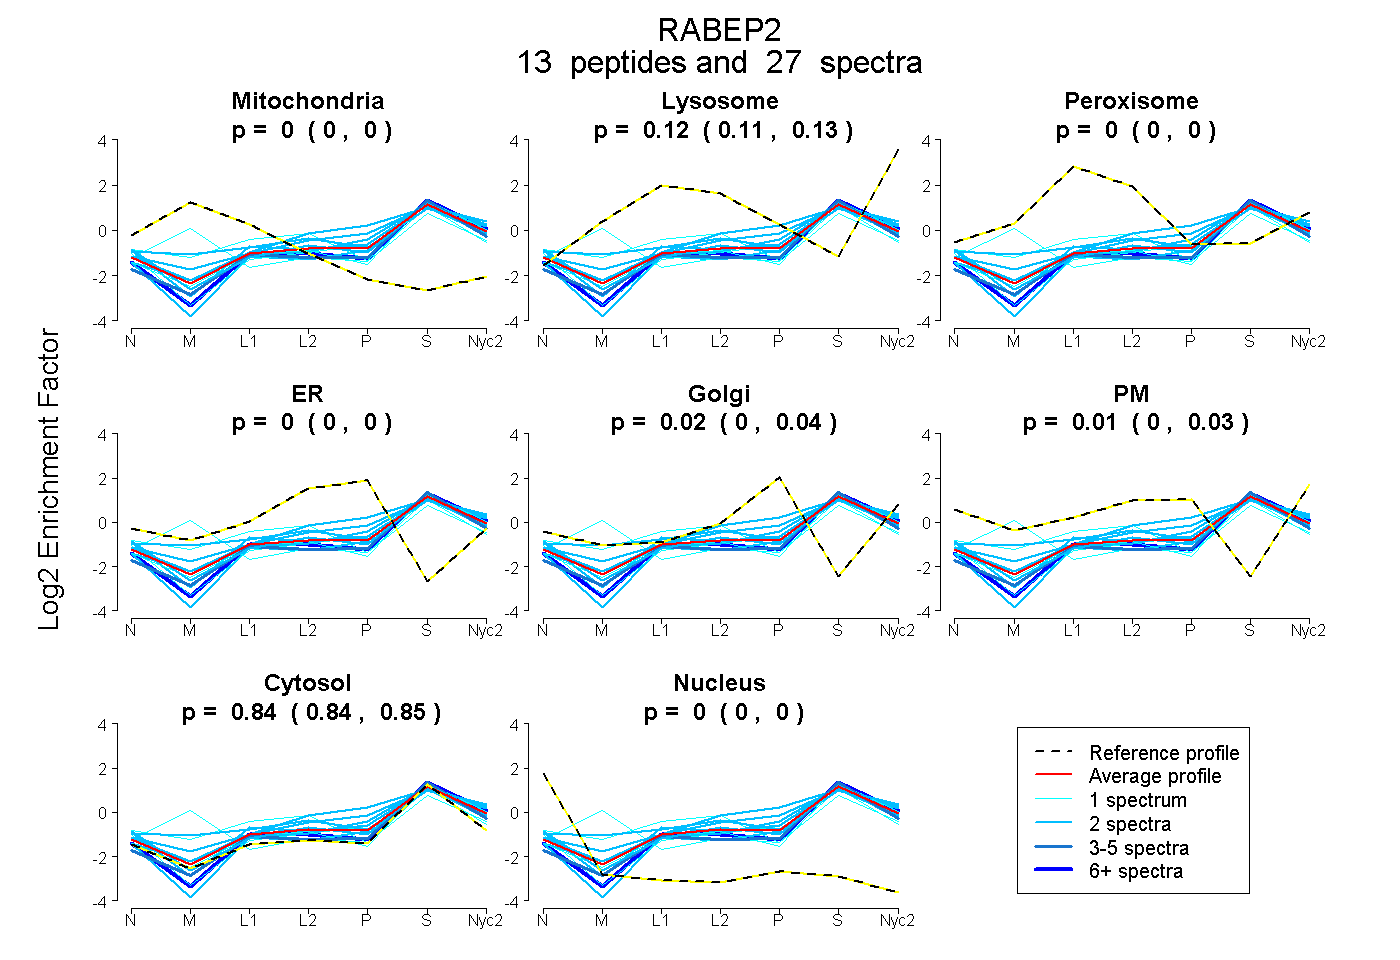
 13
13peptides
spectra
0.000 | 0.000
0.111 | 0.129
0.000 | 0.000
0.000 | 0.000
0.003 | 0.038
0.000 | 0.029
0.836 | 0.851
0.000 | 0.000
| Plot | Mito | Lyso | Perox | ER | Golgi | PM | Cytosol | Nucleus | |||||
| Expt A |
13 peptides |
27 spectra |
|
0.000 0.000 | 0.000 |
0.121 0.111 | 0.129 |
0.000 0.000 | 0.000 |
0.000 0.000 | 0.000 |
0.023 0.003 | 0.038 |
0.011 0.000 | 0.029 |
0.845 0.836 | 0.851 |
0.000 0.000 | 0.000 |
| 1 spectrum, DASESSELSR | 0.039 | 0.000 | 0.278 | 0.000 | 0.000 | 0.000 | 0.683 | 0.000 | ||
| 2 spectra, EETDVLEASLCSLR | 0.007 | 0.155 | 0.079 | 0.000 | 0.000 | 0.067 | 0.691 | 0.000 | ||
| 2 spectra, EALDEETAAK | 0.000 | 0.074 | 0.000 | 0.000 | 0.102 | 0.000 | 0.824 | 0.000 | ||
| 2 spectra, LSQALQVR | 0.000 | 0.178 | 0.000 | 0.000 | 0.126 | 0.000 | 0.696 | 0.000 | ||
| 2 spectra, QADTLEQVR | 0.000 | 0.086 | 0.000 | 0.165 | 0.043 | 0.000 | 0.706 | 0.000 | ||
| 2 spectra, EIVLPMEQEIAELK | 0.000 | 0.105 | 0.000 | 0.000 | 0.000 | 0.072 | 0.823 | 0.000 | ||
| 1 spectrum, LQAELETSEQVQR | 0.000 | 0.106 | 0.000 | 0.000 | 0.000 | 0.000 | 0.894 | 0.000 | ||
| 2 spectra, AQLTDLLSEQR | 0.000 | 0.000 | 0.000 | 0.000 | 0.025 | 0.000 | 0.975 | 0.000 | ||
| 1 spectrum, ASLEGQLR | 0.000 | 0.045 | 0.000 | 0.000 | 0.085 | 0.000 | 0.871 | 0.000 | ||
| 1 spectrum, AVAEVSESTK | 0.264 | 0.085 | 0.000 | 0.000 | 0.000 | 0.000 | 0.652 | 0.000 | ||
| 2 spectra, VQQEHHK | 0.000 | 0.046 | 0.000 | 0.000 | 0.000 | 0.093 | 0.861 | 0.000 | ||
| 6 spectra, AEELIQEIQR | 0.000 | 0.069 | 0.000 | 0.000 | 0.000 | 0.000 | 0.931 | 0.000 | ||
| 3 spectra, SILDEAPLR | 0.000 | 0.055 | 0.000 | 0.000 | 0.000 | 0.000 | 0.945 | 0.000 |
| Plot | Mito | Lyso or Perox | ER | Golgi | PM | Cytosol | Nucleus | ||||||
| Expt B |
3 peptides |
4 spectra |
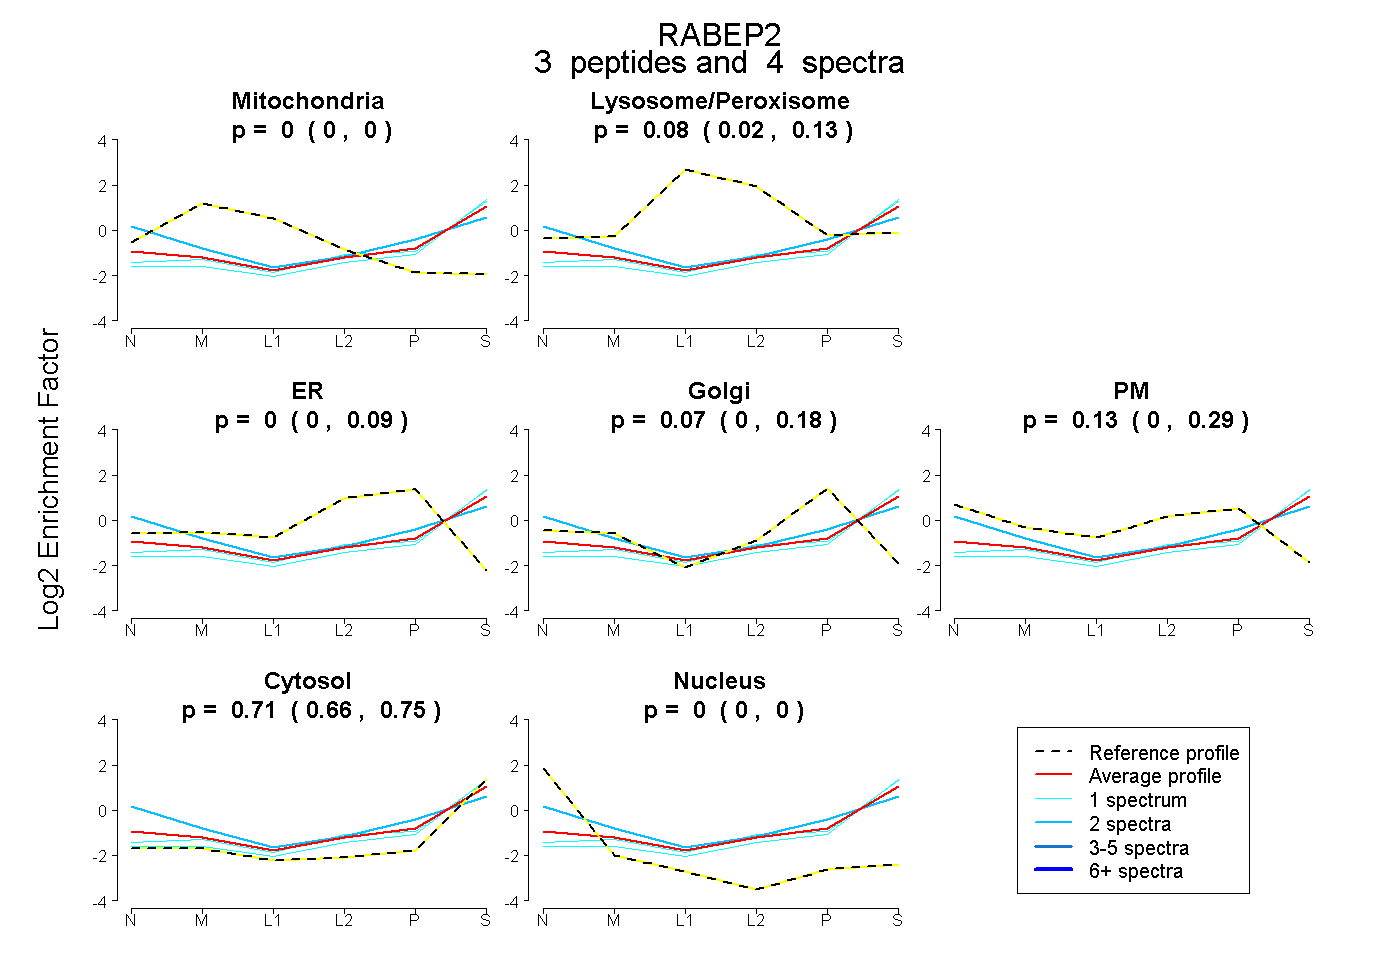 |
0.000 0.000 | 0.000 |
0.083 0.019 | 0.131 |
0.000 0.000 | 0.086 |
0.073 0.000 | 0.181 |
0.134 0.000 | 0.291 |
0.710 0.660 | 0.754 |
0.000 0.000 | 0.000 |
|||
| Plot | Lyso | Other | |||||||||||
| Expt C |
11 peptides |
28 spectra |
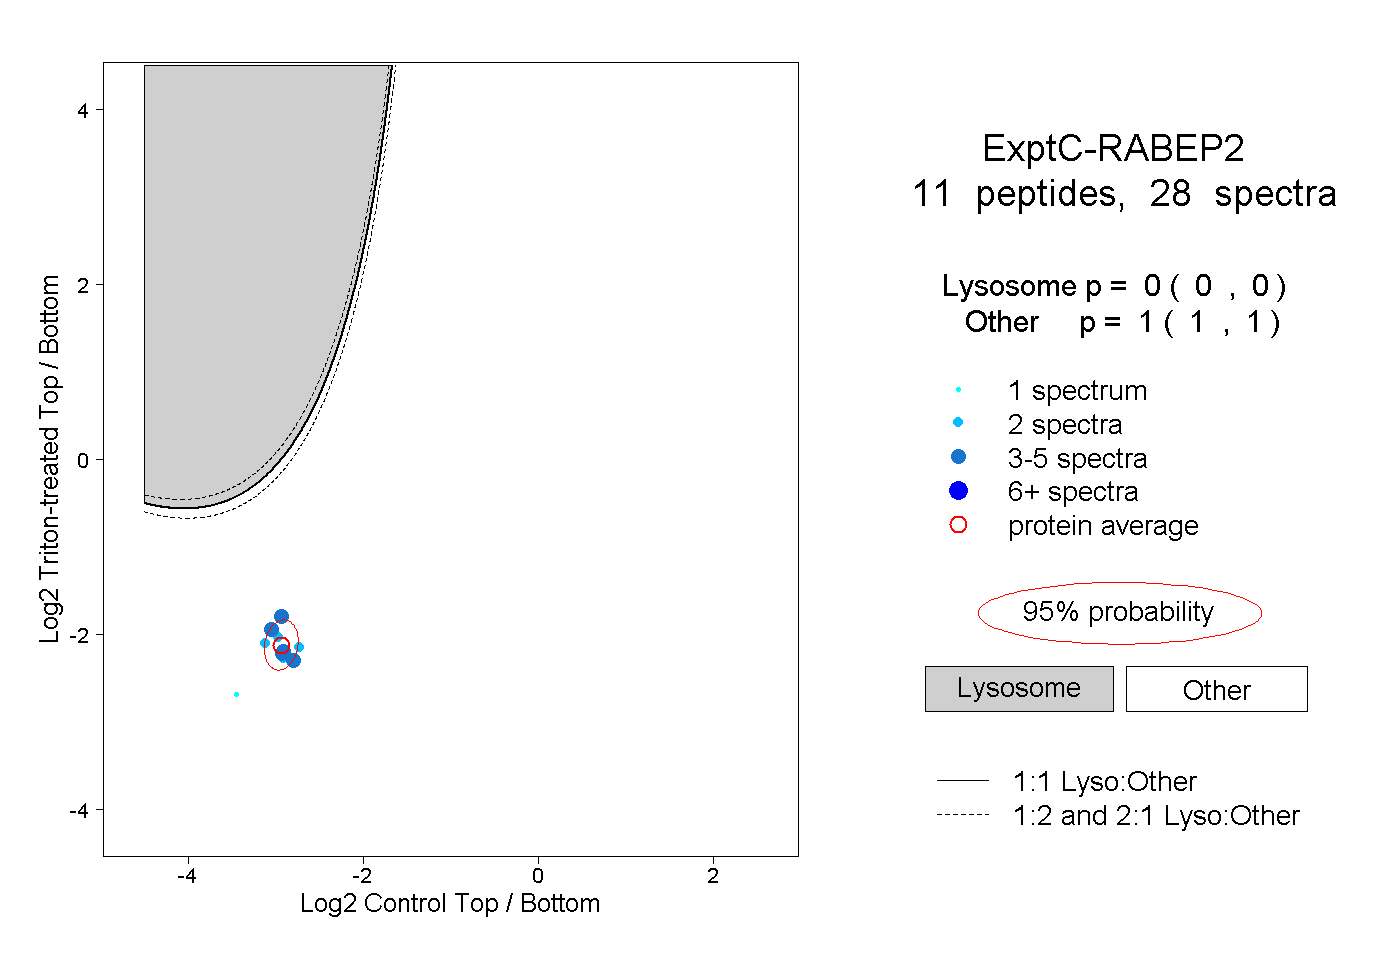 |
0.000 0.000 | 0.000 |
1.000 1.000 | 1.000 |