RABEP2
[ENSRNOP00000025043]
Main page
| | | Plot |
Mito |
Lyso |
|
Perox |
ER |
Golgi |
PM |
Cytosol |
Nucleus |
|
| Expt A |
 13
13
peptides |
27
spectra |
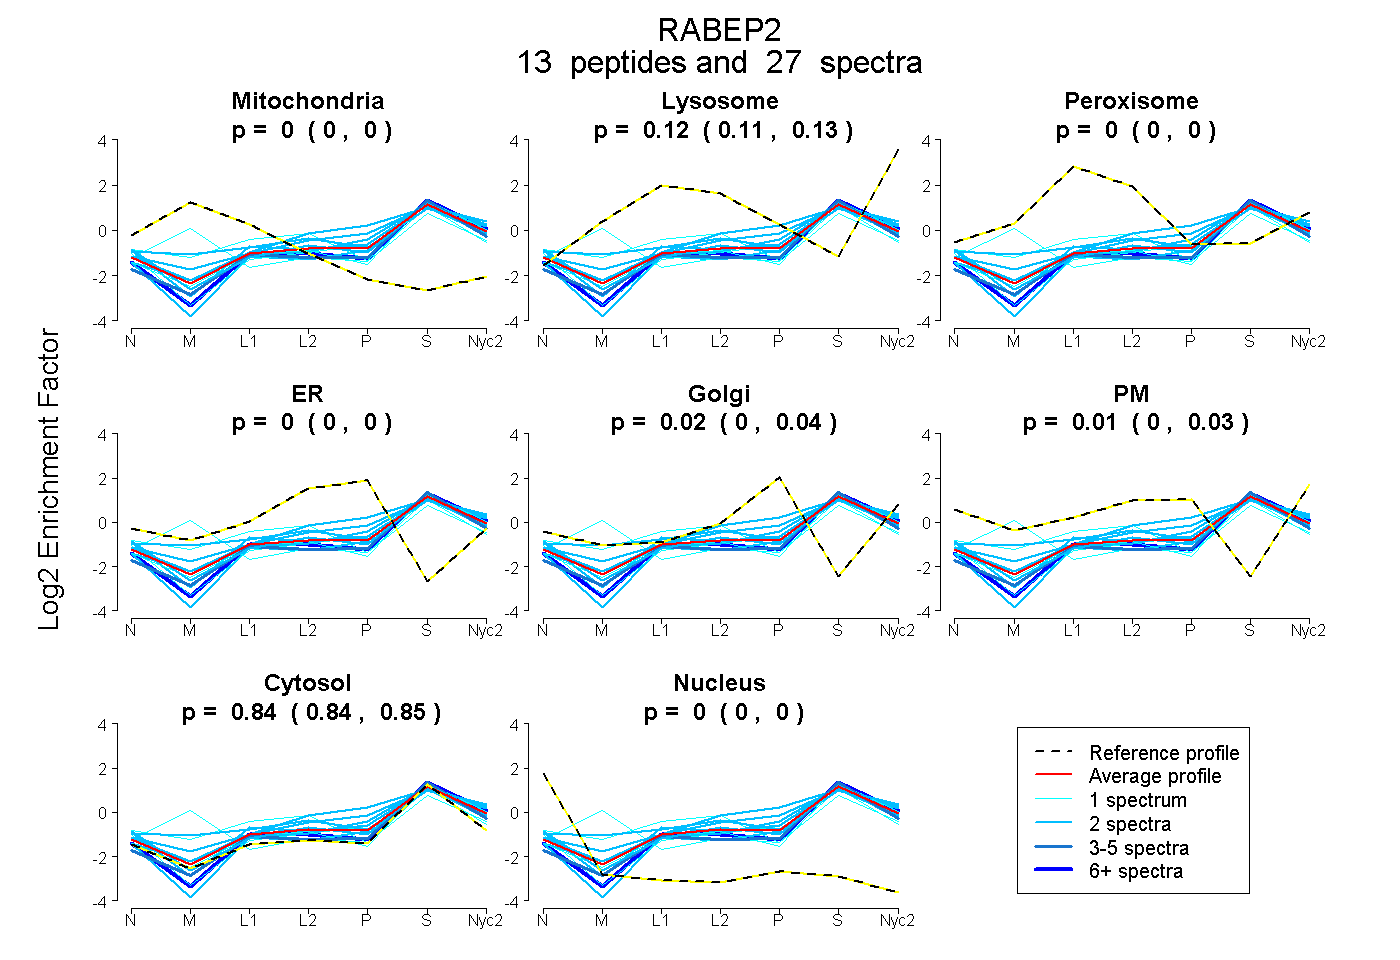 |
0.000
0.000 | 0.000 |
0.121
0.111 | 0.129 |
|
0.000
0.000 | 0.000 |
0.000
0.000 | 0.000 |
0.023
0.003 | 0.038 |
0.011
0.000 | 0.029 |
0.845
0.836 | 0.851 |
0.000
0.000 | 0.000 |
|
| | | Plot |
Mito |
|
Lyso or Perox |
|
ER |
Golgi |
PM |
Cytosol |
Nucleus |
|
| Expt B |
3
peptides |
4
spectra |
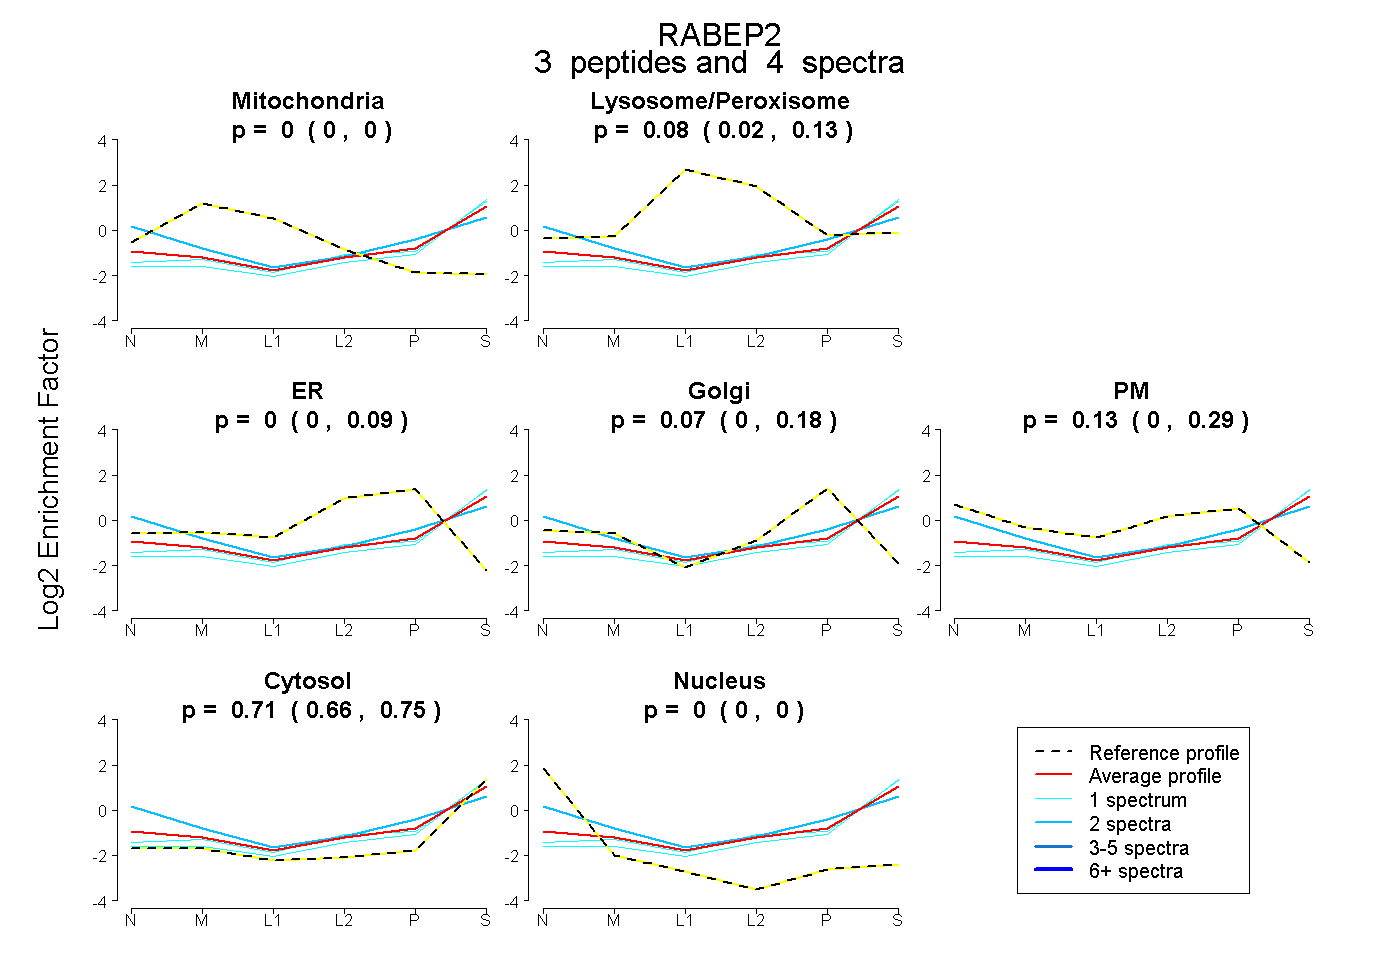 |
0.000
0.000 | 0.000 |
|
0.083
0.019 | 0.131 |
|
0.000
0.000 | 0.086 |
0.073
0.000 | 0.181 |
0.134
0.000 | 0.291 |
0.710
0.660 | 0.754 |
0.000
0.000 | 0.000 |
|
| 2 spectra, ELGHLK |
0.000 |
|
0.000 |
|
0.000 |
0.000 |
0.467 |
0.533 |
0.000 |
|
| 1 spectrum, LSQALQVR |
0.000 |
|
0.040 |
|
0.089 |
0.000 |
0.000 |
0.870 |
0.000 |
|
| 1 spectrum, AEELIQEIQR |
0.000 |
|
0.089 |
|
0.118 |
0.000 |
0.000 |
0.793 |
0.000 |
|
| | | Plot |
|
Lyso |
|
|
|
|
|
|
|
Other |
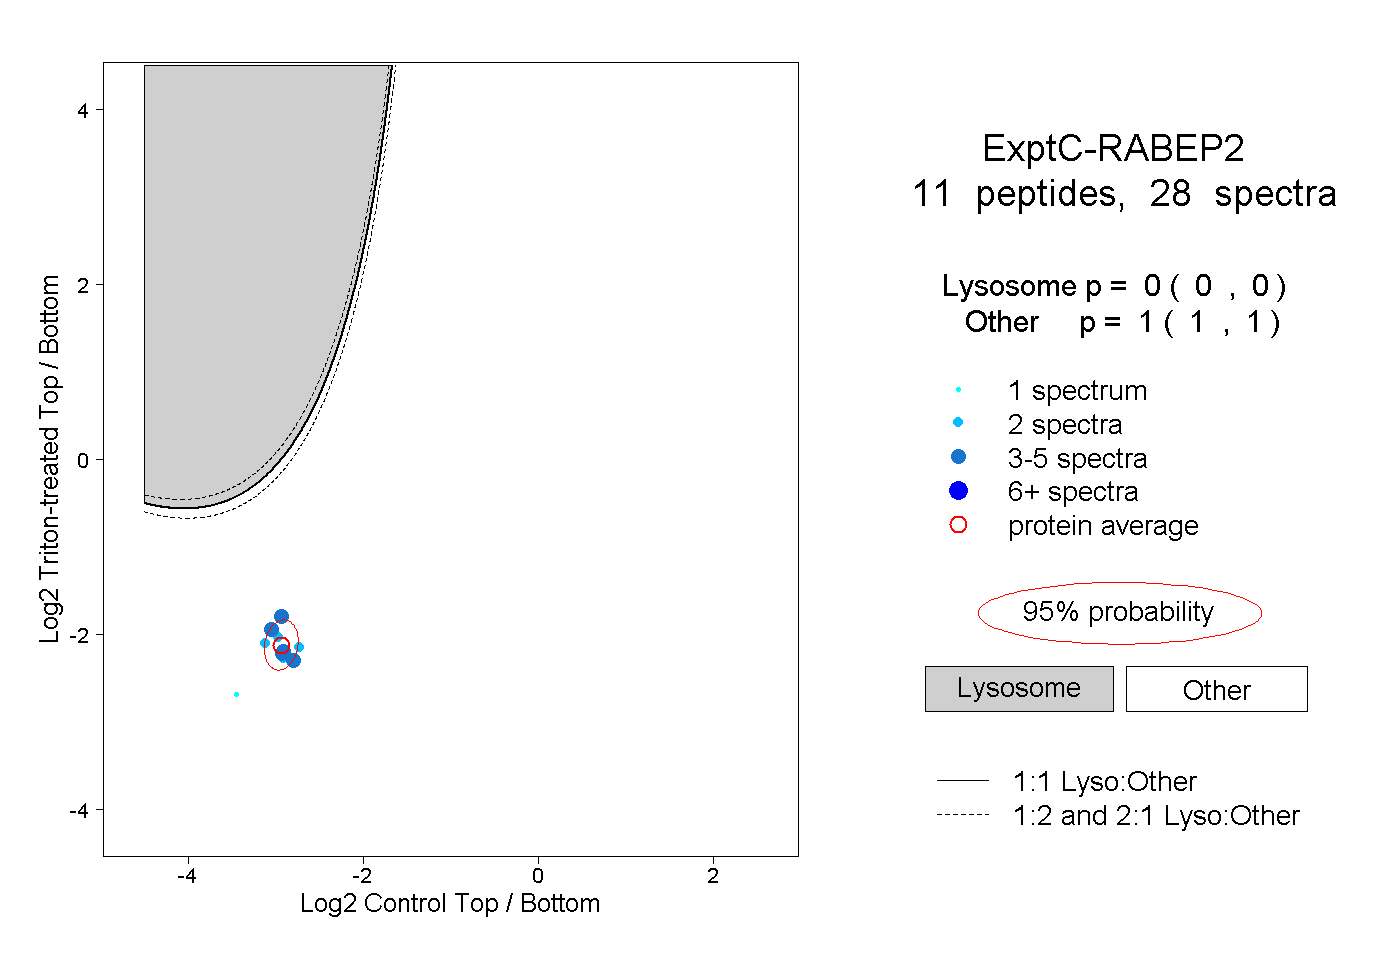
| Expt C |
11
peptides |
28
spectra |
 |
|
0.000
0.000 | 0.000 |
|
|
|
|
|
|
|
1.000
1.000 | 1.000 |