 32
32peptides
spectra
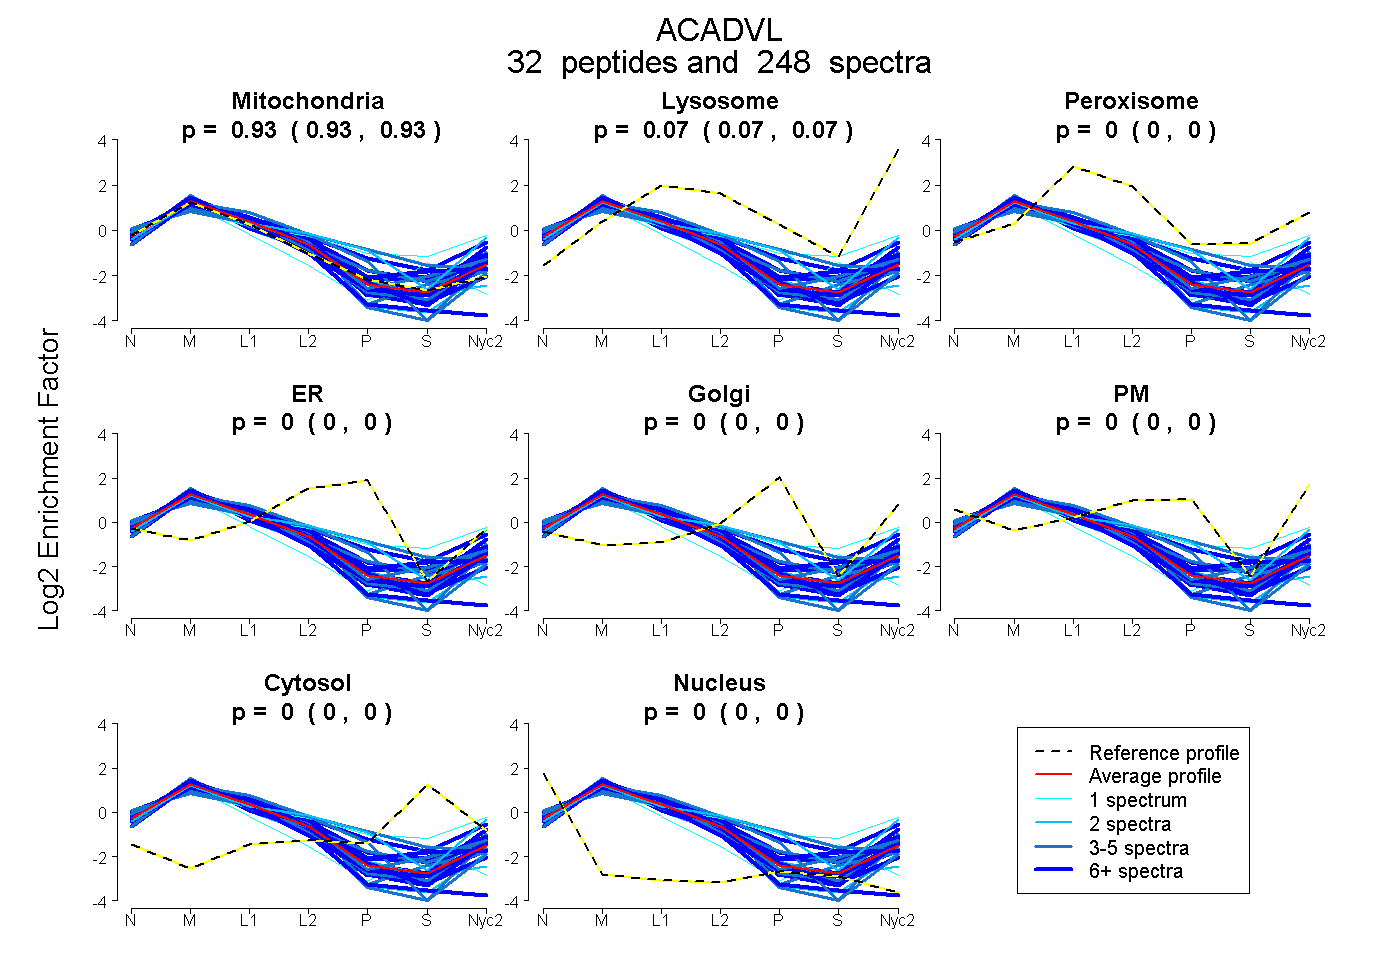
0.930 | 0.932
0.067 | 0.070
0.000 | 0.000
0.000 | 0.000
0.000 | 0.000
0.000 | 0.000
0.000 | 0.000
0.000 | 0.000
28peptides
spectra
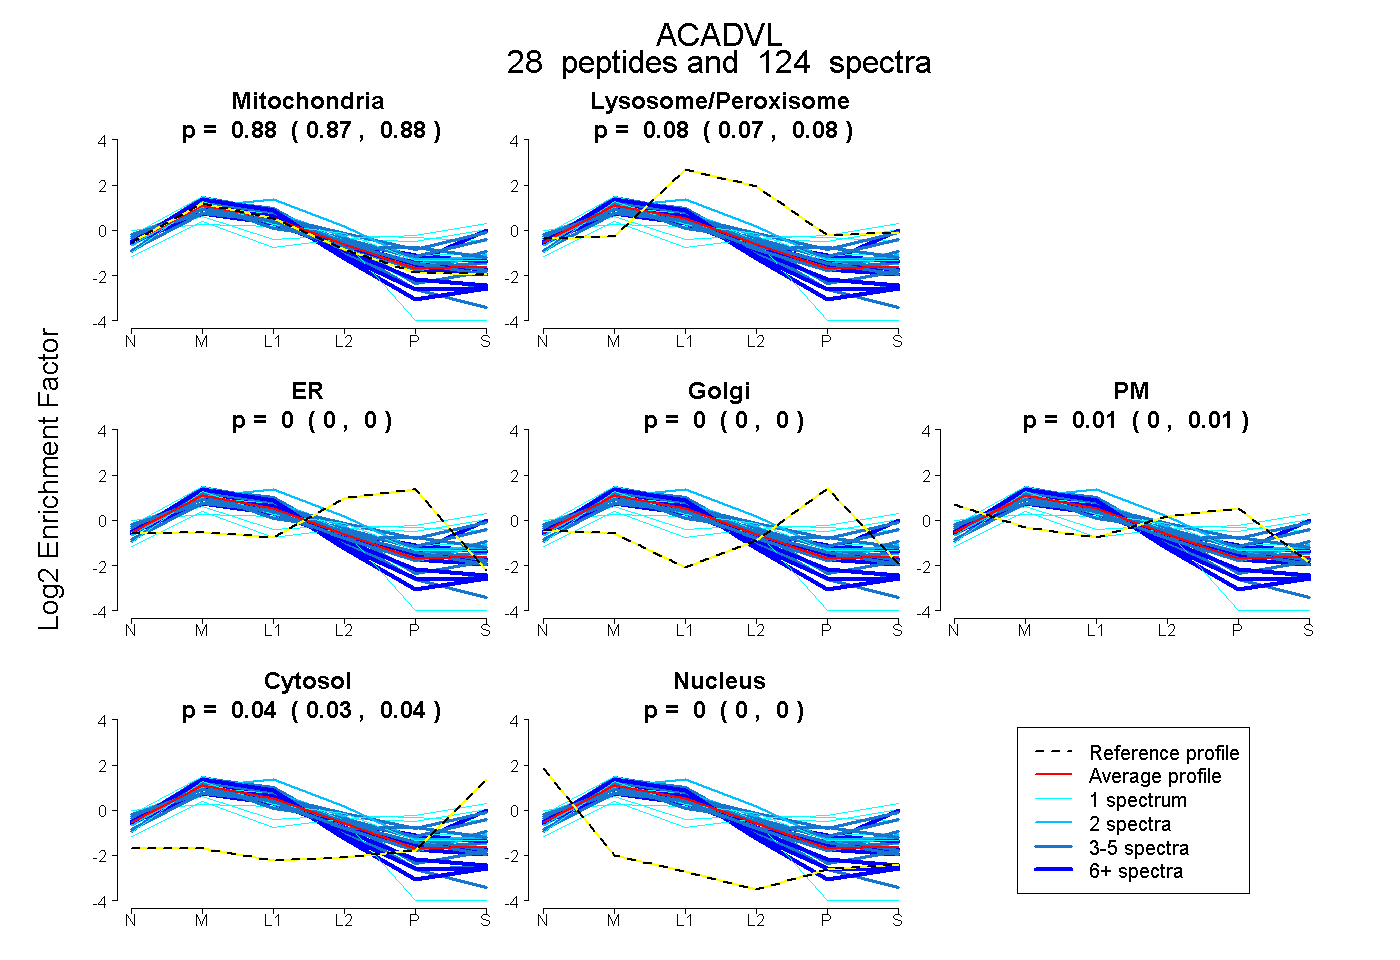
0.871 | 0.883
0.074 | 0.083
0.000 | 0.000
0.000 | 0.000
0.000 | 0.013
0.032 | 0.040
0.000 | 0.000
34peptides
spectra
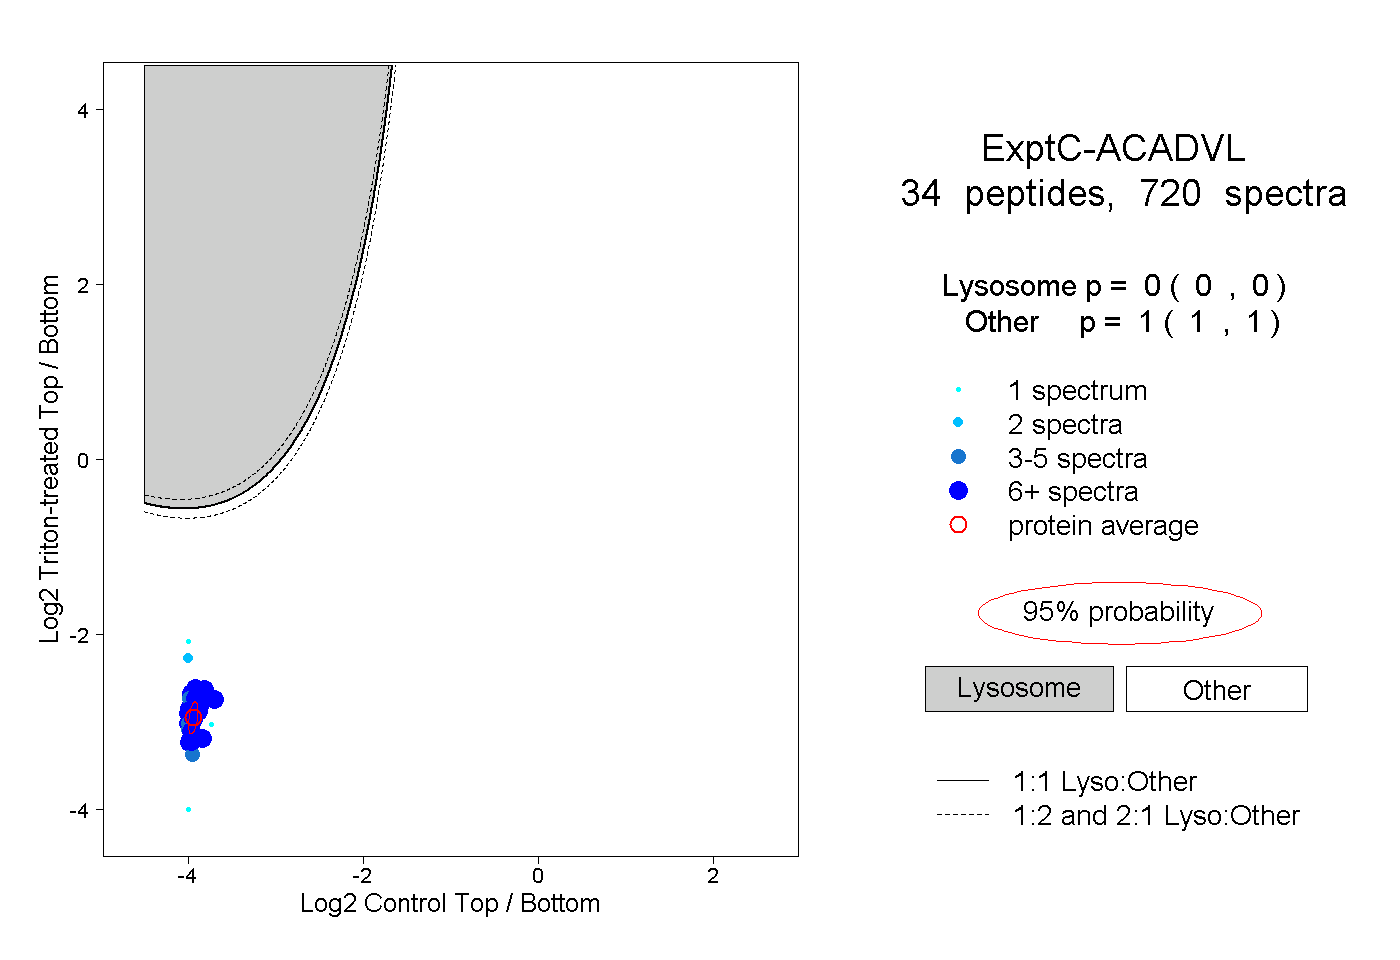
0.000 | 0.000
1.000 | 1.000
18peptides
spectra
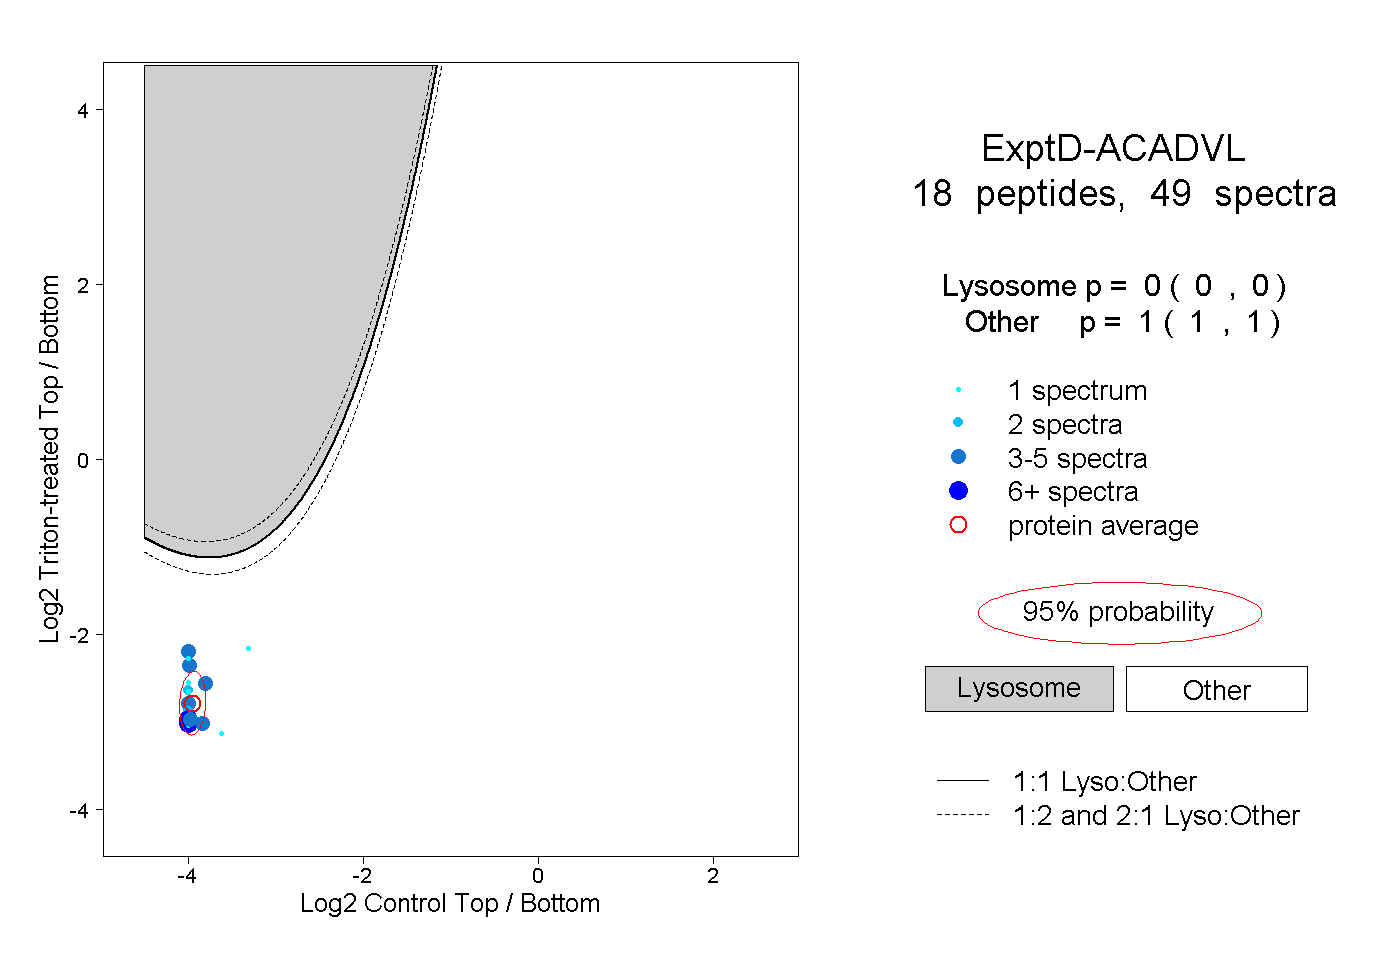
0.000 | 0.000
1.000 | 1.000