 5
5peptides
spectra
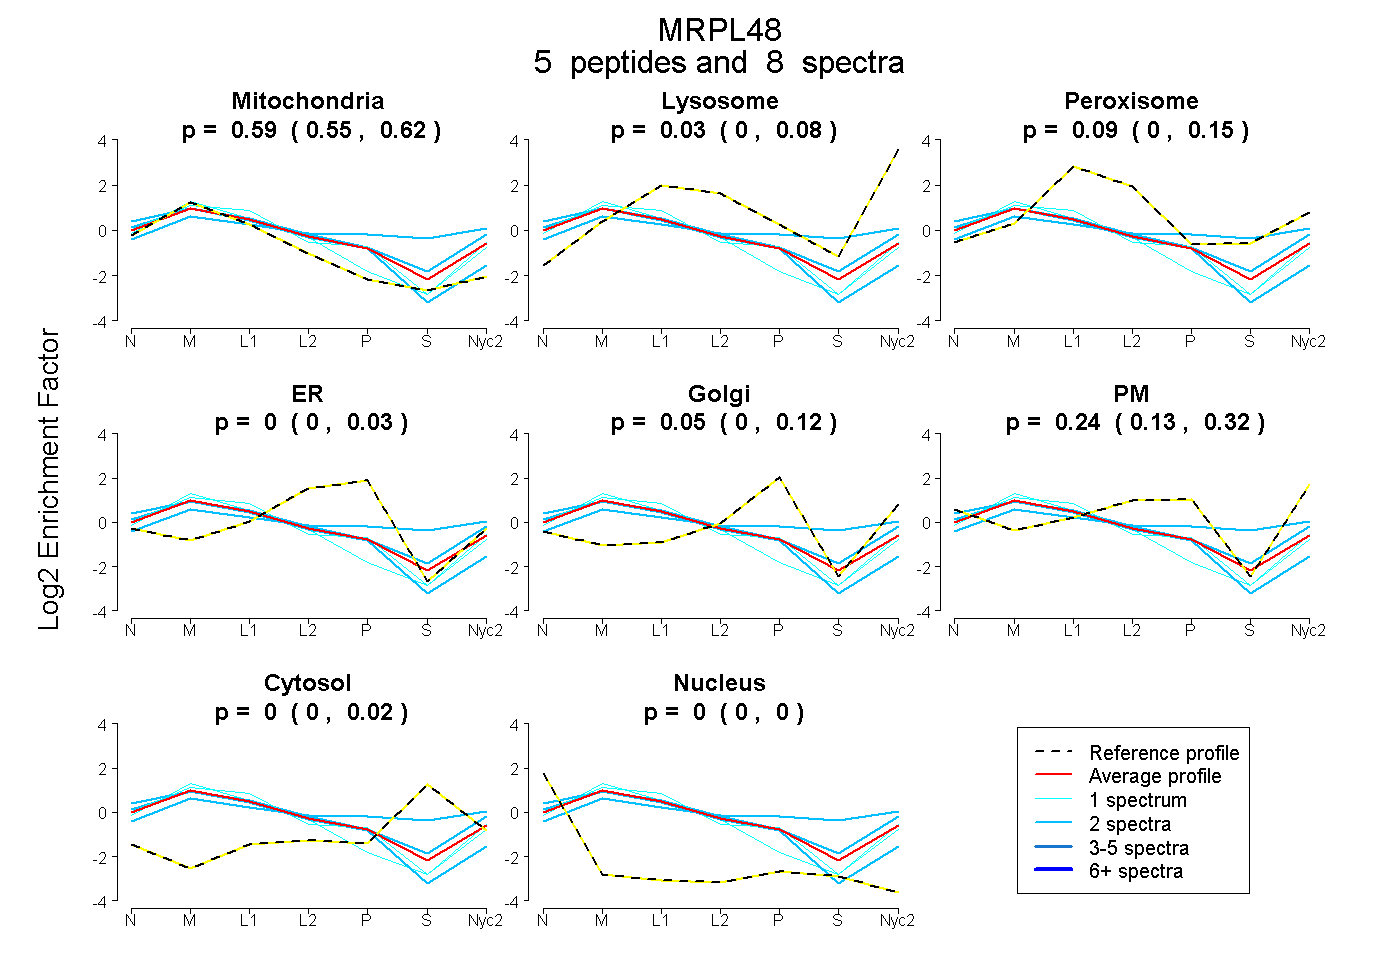
0.551 | 0.624
0.000 | 0.080
0.000 | 0.155
0.000 | 0.026
0.000 | 0.118
0.127 | 0.316
0.000 | 0.018
0.000 | 0.000
2peptides
spectra
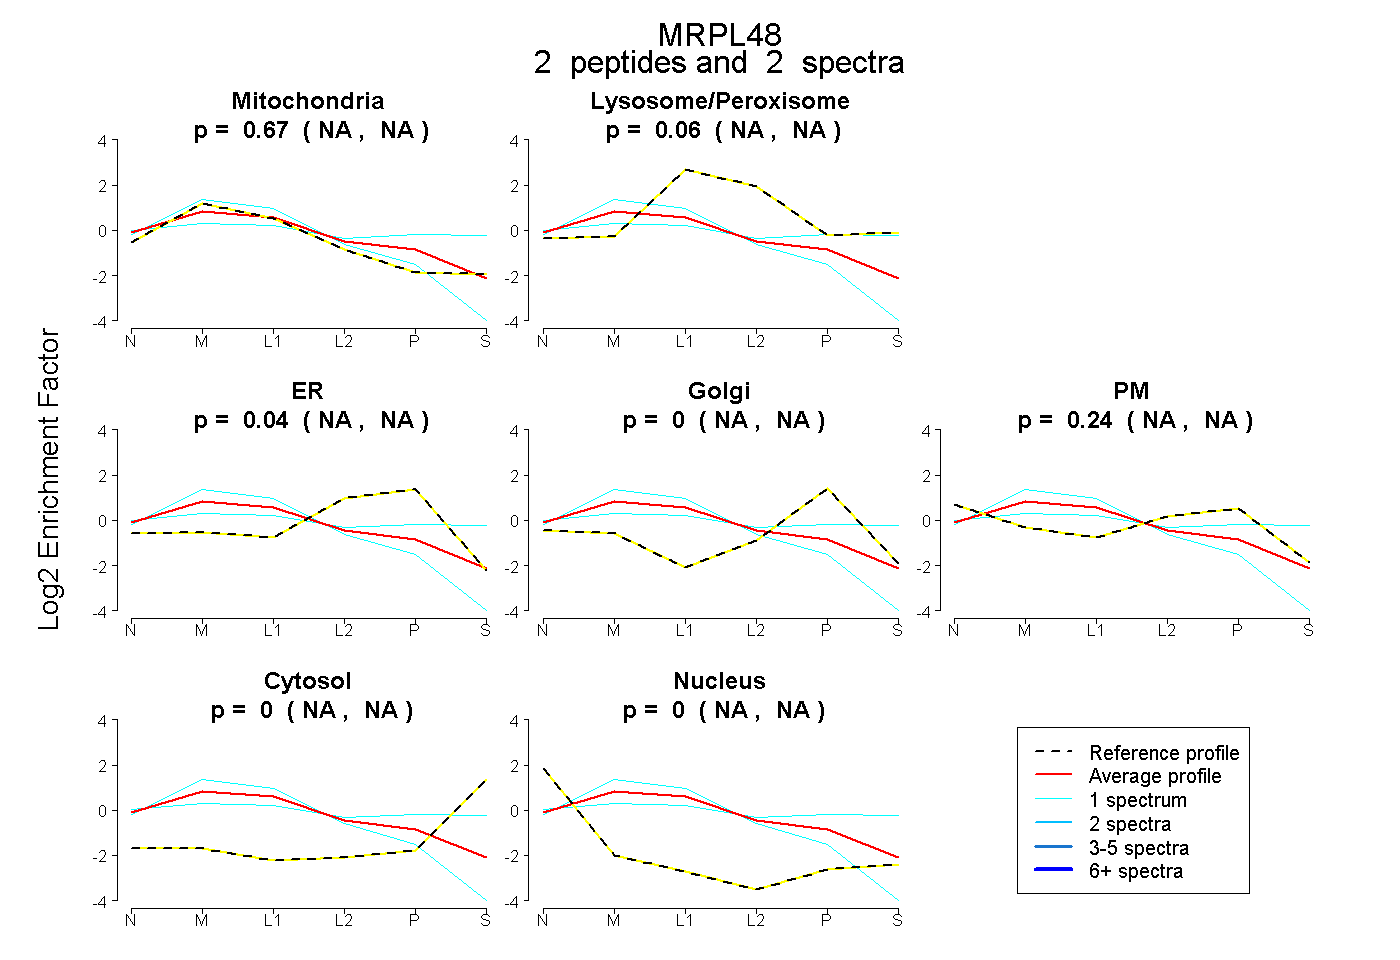
NA | NA
NA | NA
NA | NA
NA | NA
NA | NA
NA | NA
NA | NA
8peptides
spectra
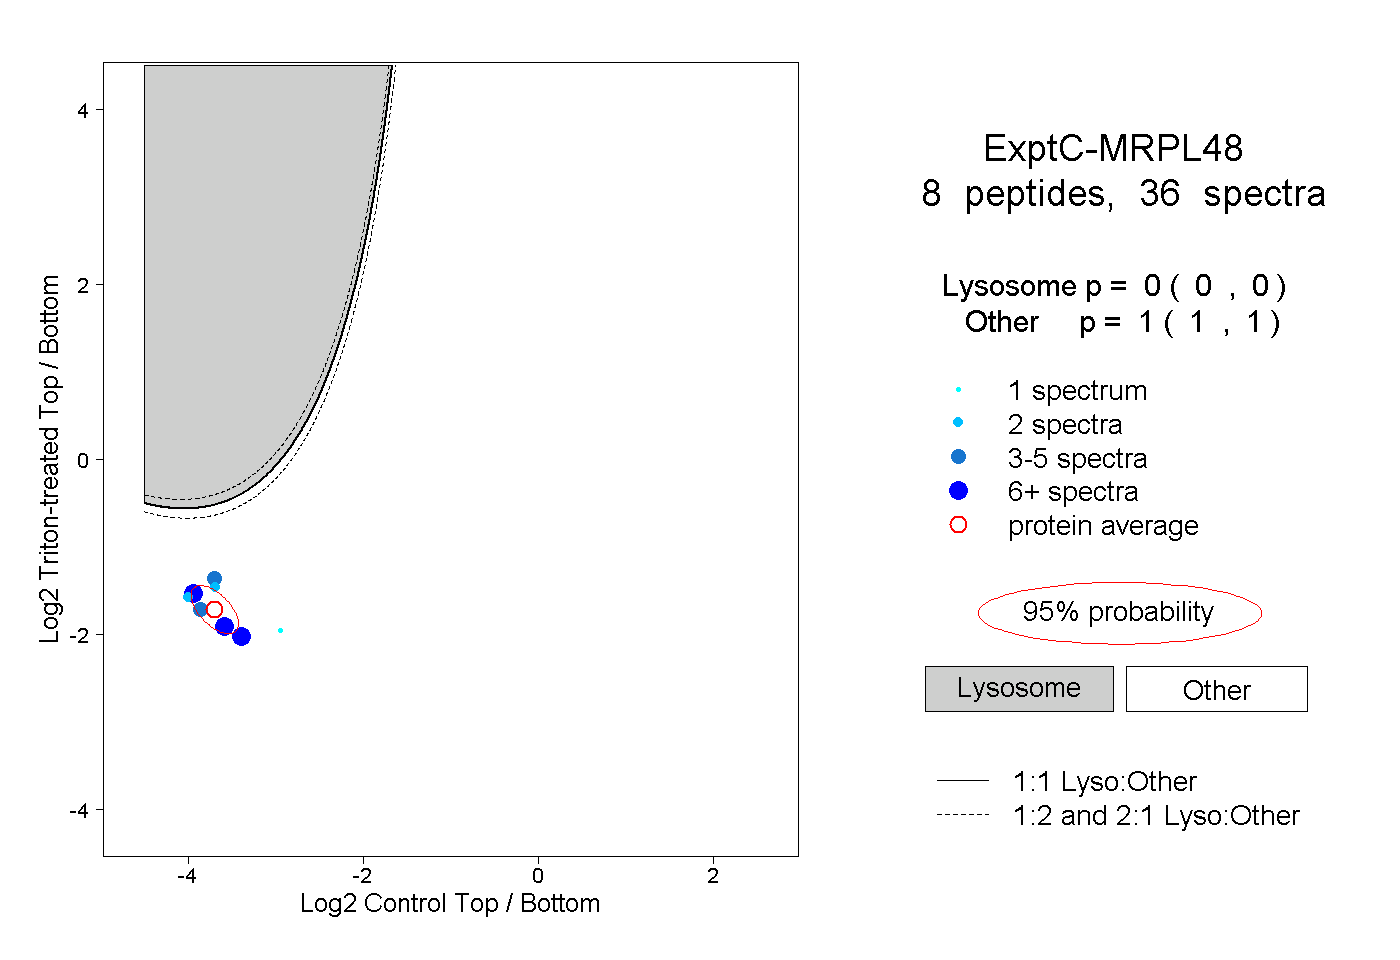
0.000 | 0.000
1.000 | 1.000