 5
5peptides
spectra
0.551 | 0.624
0.000 | 0.080
0.000 | 0.155
0.000 | 0.026
0.000 | 0.118
0.127 | 0.316
0.000 | 0.018
0.000 | 0.000
| Plot | Mito | Lyso | Perox | ER | Golgi | PM | Cytosol | Nucleus | |||||
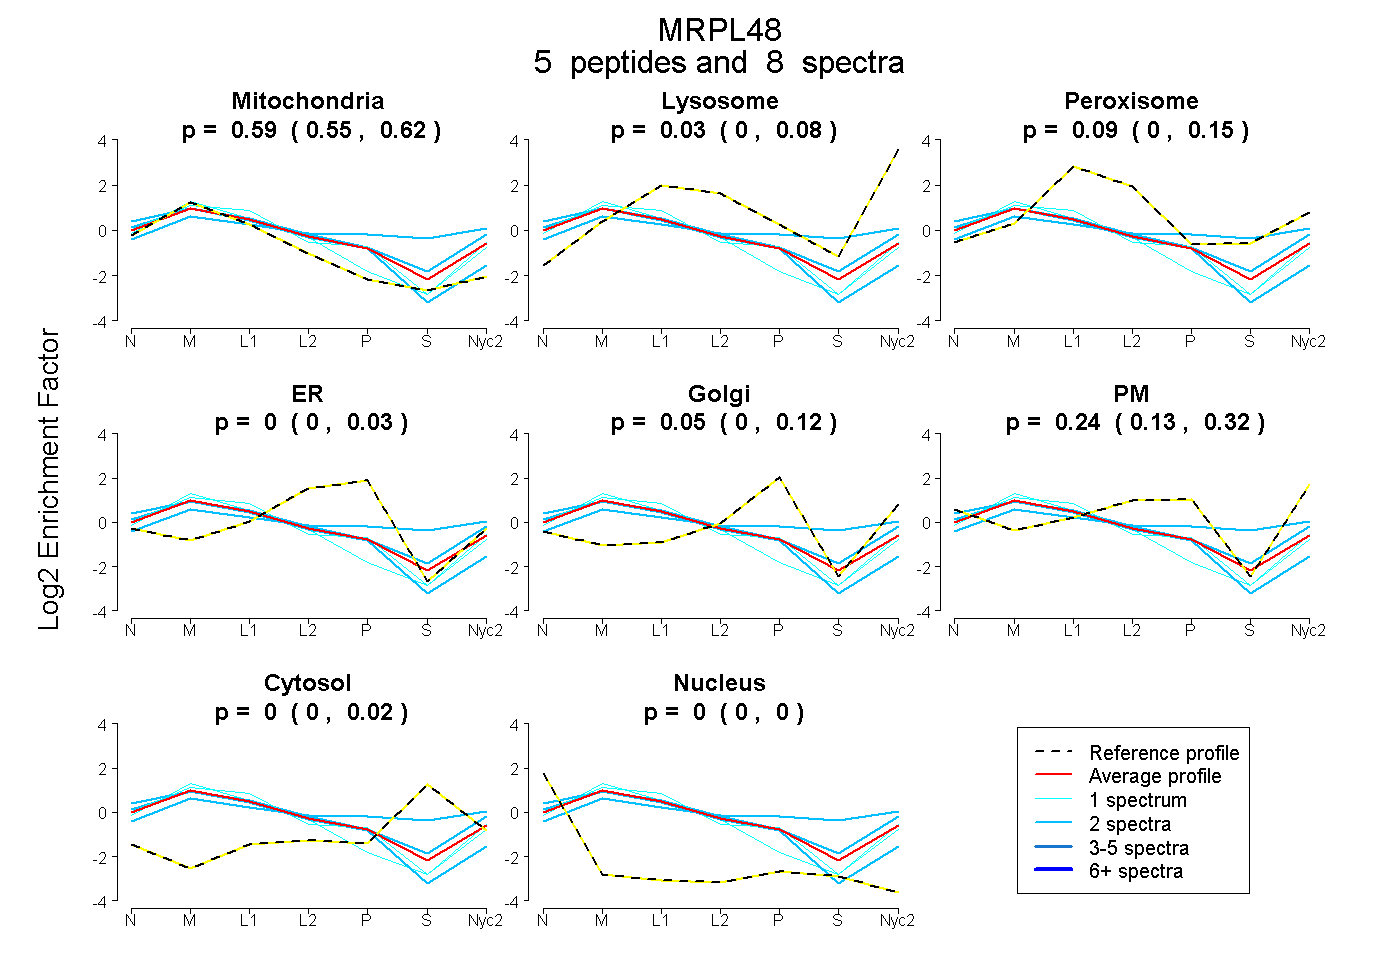
| Expt A |
5 peptides |
8 spectra |
|
0.594 0.551 | 0.624 |
0.027 0.000 | 0.080 |
0.089 0.000 | 0.155 |
0.000 0.000 | 0.026 |
0.047 0.000 | 0.118 |
0.242 0.127 | 0.316 |
0.000 0.000 | 0.018 |
0.000 0.000 | 0.000 |
| 1 spectrum, VEESYAMPTK | 0.655 | 0.036 | 0.017 | 0.017 | 0.000 | 0.274 | 0.000 | 0.000 | ||
| 2 spectra, MVLDSVLTTHER | 0.265 | 0.133 | 0.216 | 0.000 | 0.168 | 0.000 | 0.219 | 0.000 | ||
| 2 spectra, LCNQLSIK | 0.523 | 0.063 | 0.105 | 0.000 | 0.000 | 0.291 | 0.018 | 0.000 | ||
| 2 spectra, TKPTHGIGR | 0.704 | 0.000 | 0.000 | 0.224 | 0.000 | 0.072 | 0.000 | 0.000 | ||
| 1 spectrum, EHTEEDFK | 0.759 | 0.157 | 0.000 | 0.000 | 0.000 | 0.085 | 0.000 | 0.000 |
| Plot | Mito | Lyso or Perox | ER | Golgi | PM | Cytosol | Nucleus | ||||||
| Expt B |
2 peptides |
2 spectra |
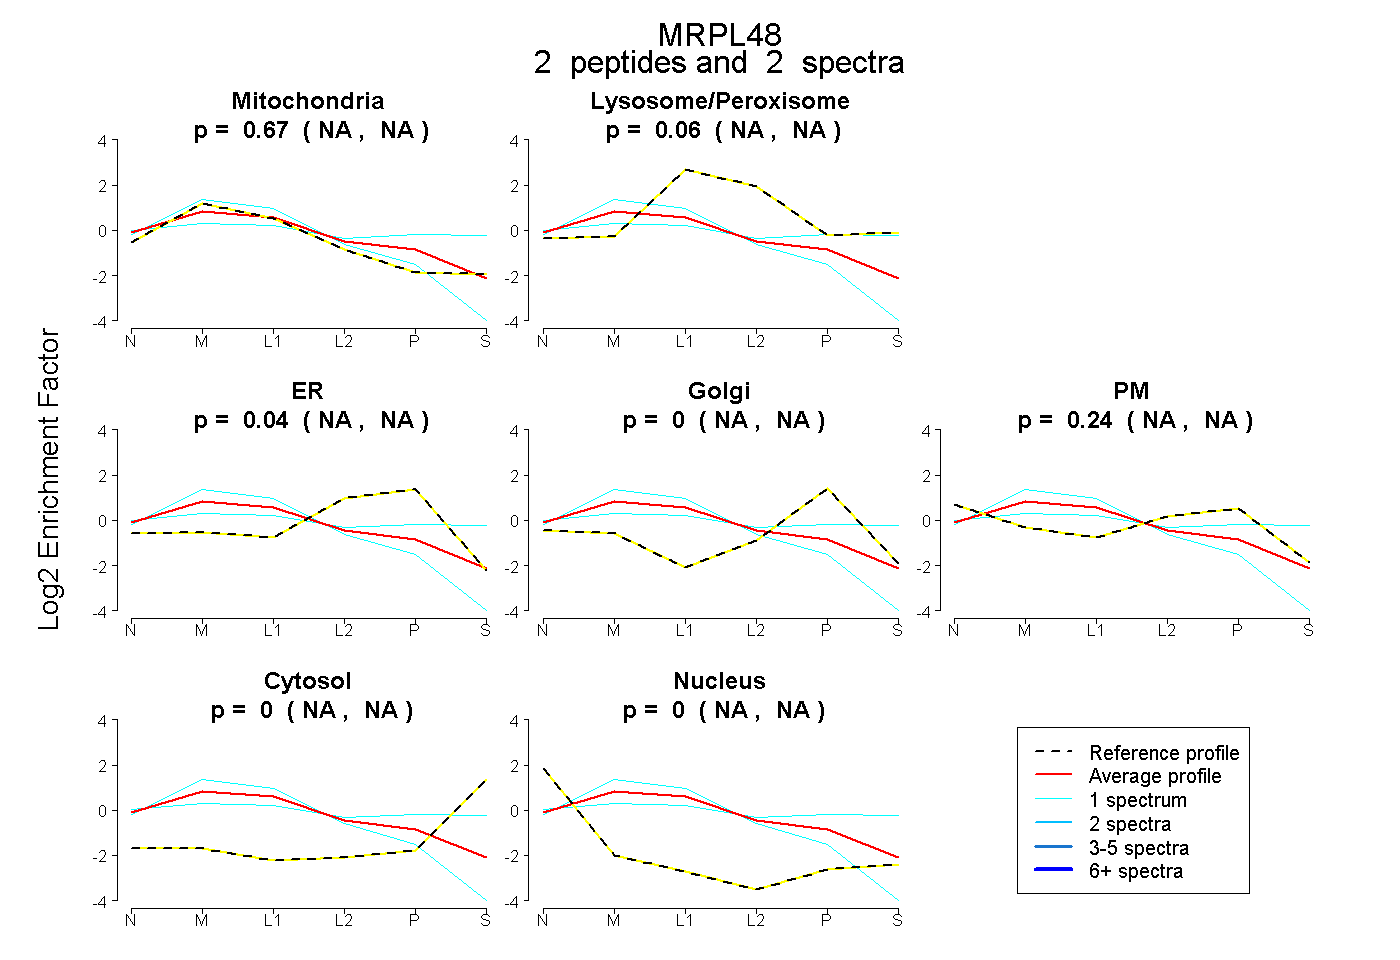 |
0.666 NA | NA |
0.059 NA | NA |
0.036 NA | NA |
0.000 NA | NA |
0.239 NA | NA |
0.000 NA | NA |
0.000 NA | NA |
|||
| Plot | Lyso | Other | |||||||||||
| Expt C |
8 peptides |
36 spectra |
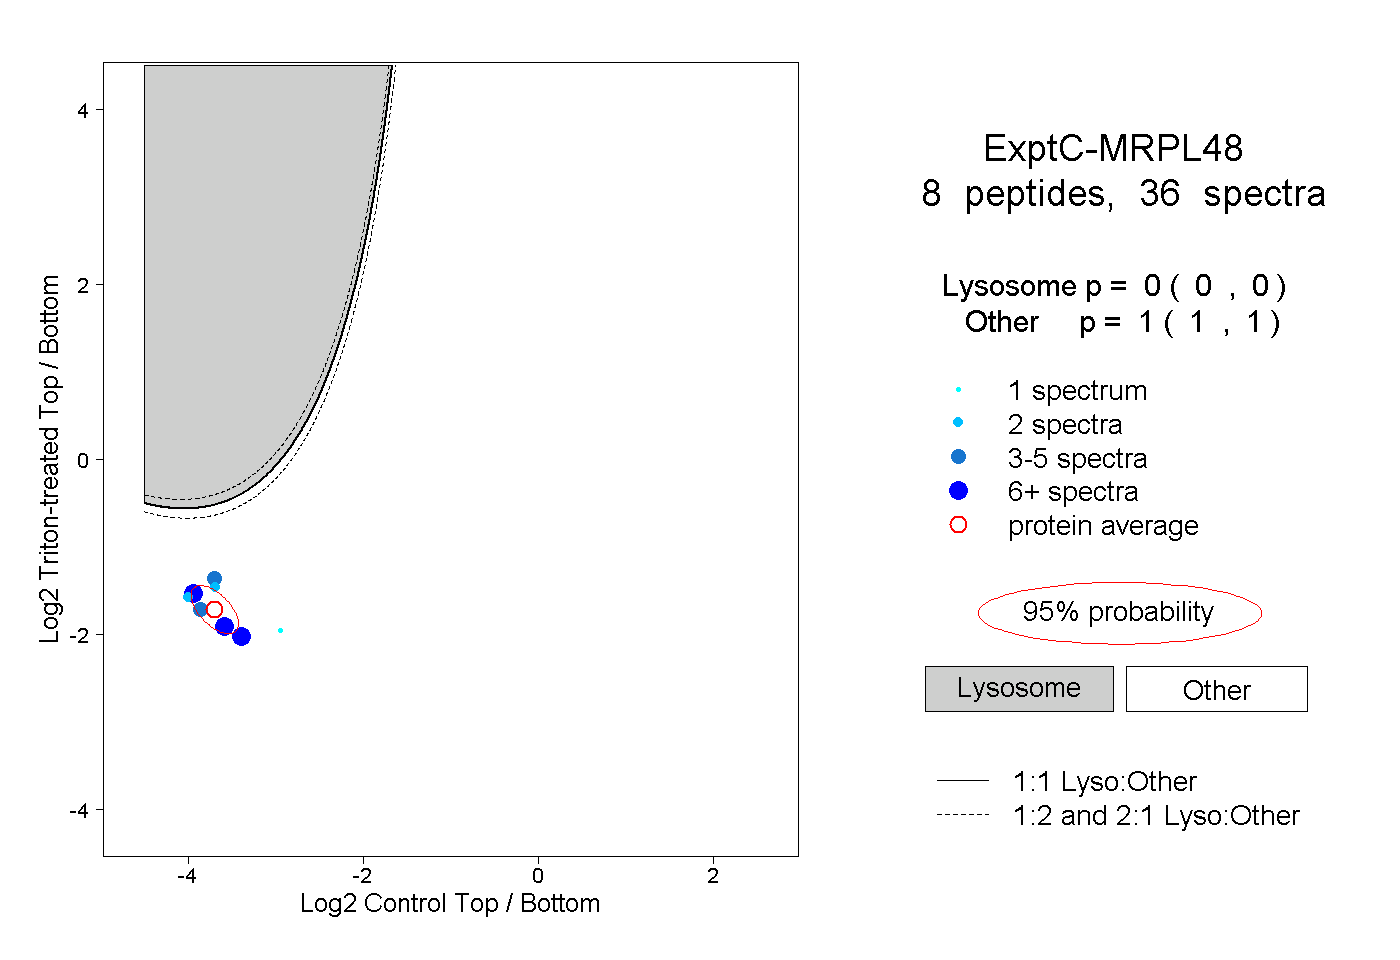 |
0.000 0.000 | 0.000 |
1.000 1.000 | 1.000 |