 5
5peptides
spectra
0.551 | 0.624
0.000 | 0.080
0.000 | 0.155
0.000 | 0.026
0.000 | 0.118
0.127 | 0.316
0.000 | 0.018
0.000 | 0.000
2peptides
spectra
NA | NA
NA | NA
NA | NA
NA | NA
NA | NA
NA | NA
NA | NA
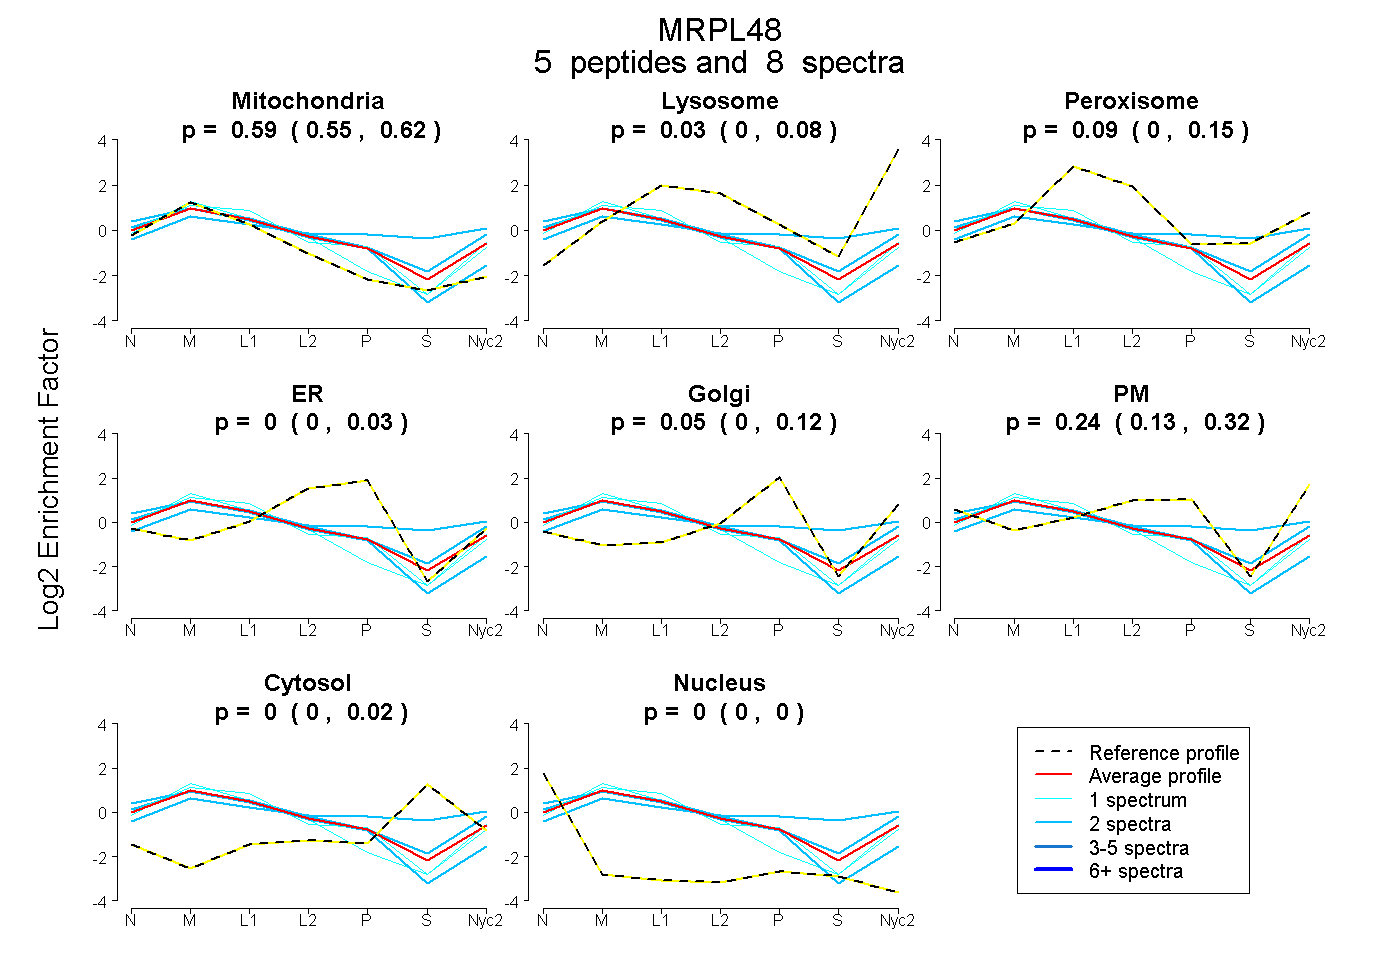
| Plot | Mito | Lyso | Perox | ER | Golgi | PM | Cytosol | Nucleus | |||||
| Expt A |
5 peptides |
8 spectra |
|
0.594 0.551 | 0.624 |
0.027 0.000 | 0.080 |
0.089 0.000 | 0.155 |
0.000 0.000 | 0.026 |
0.047 0.000 | 0.118 |
0.242 0.127 | 0.316 |
0.000 0.000 | 0.018 |
0.000 0.000 | 0.000 |
||
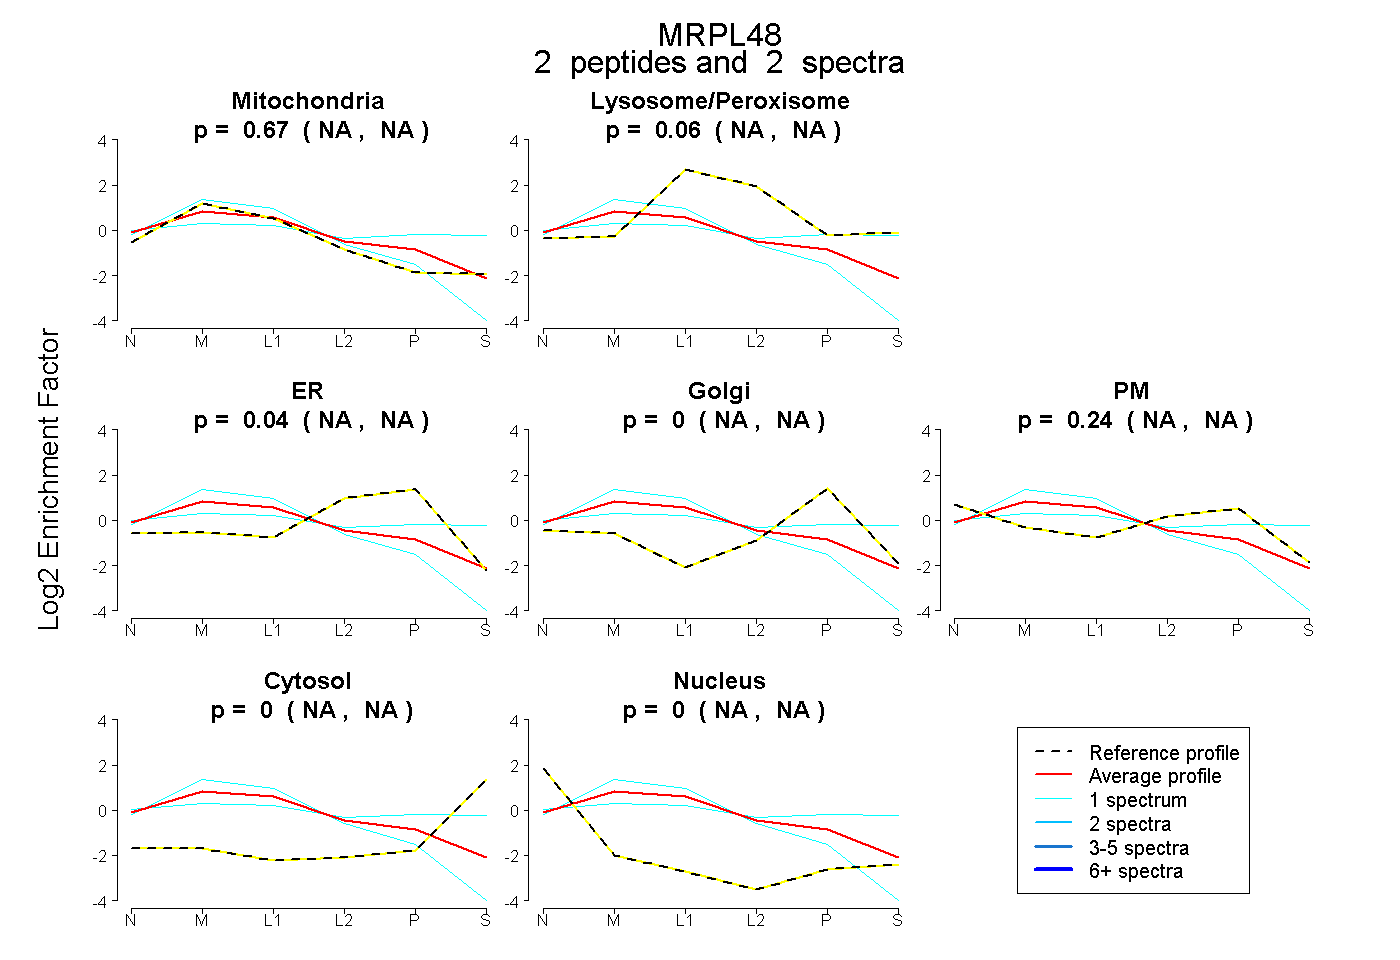
| Plot | Mito | Lyso or Perox | ER | Golgi | PM | Cytosol | Nucleus | ||||||
| Expt B |
2 peptides |
2 spectra |
|
0.666 NA | NA |
0.059 NA | NA |
0.036 NA | NA |
0.000 NA | NA |
0.239 NA | NA |
0.000 NA | NA |
0.000 NA | NA |
| 1 spectrum, TKPTHGIGR | 0.193 | 0.283 | 0.000 | 0.032 | 0.301 | 0.192 | 0.000 | |||
| 1 spectrum, ARPELEELLAK | 0.933 | 0.000 | 0.067 | 0.000 | 0.000 | 0.000 | 0.000 |
| Plot | Lyso | Other | |||||||||||
| Expt C |
8 peptides |
36 spectra |
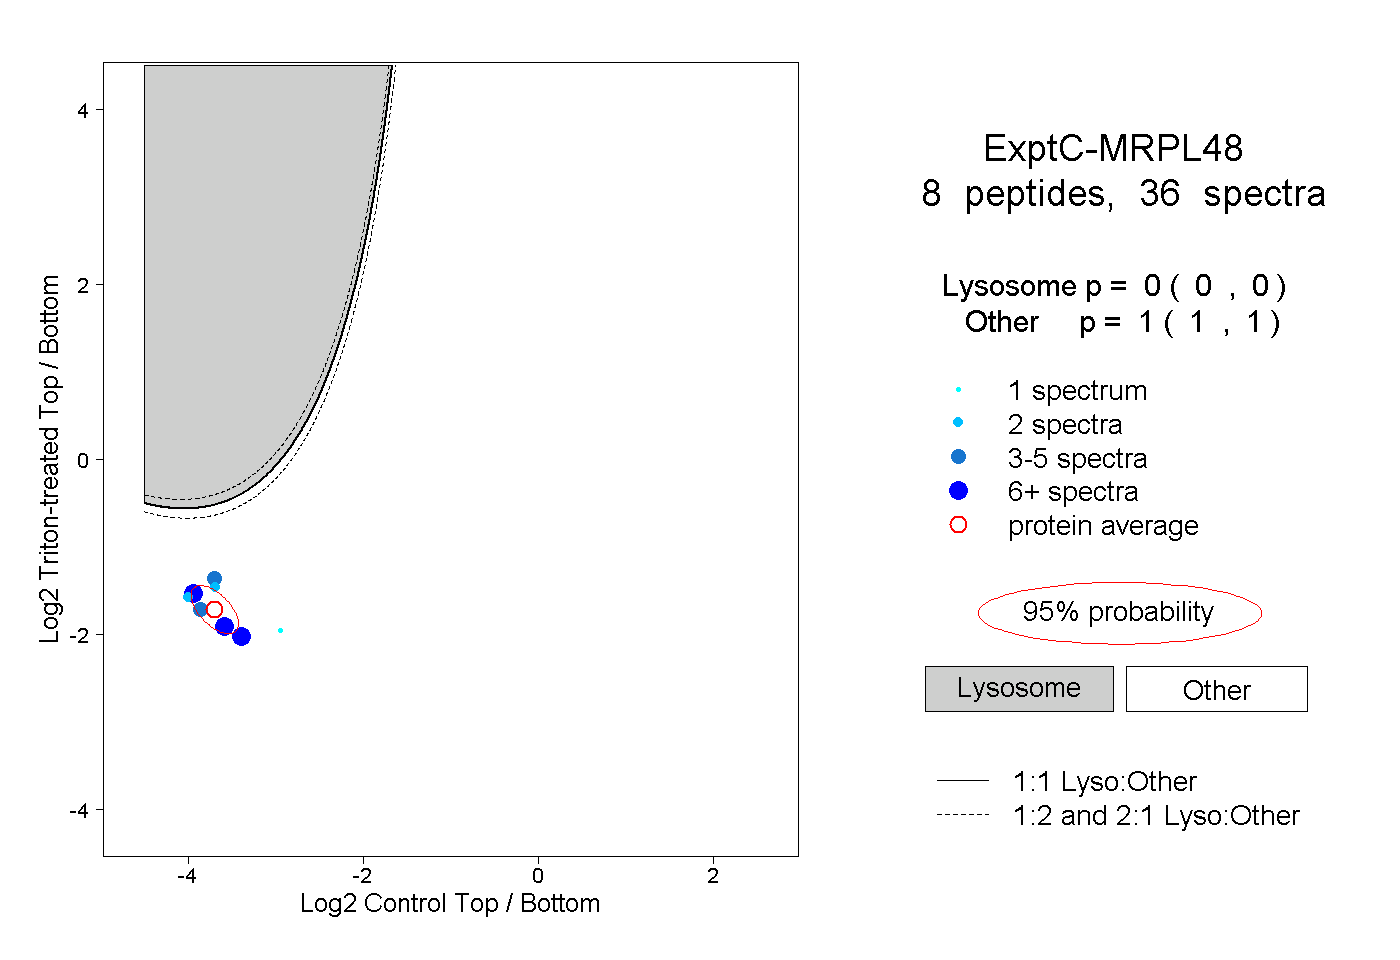 |
0.000 0.000 | 0.000 |
1.000 1.000 | 1.000 |