 36
36peptides
spectra
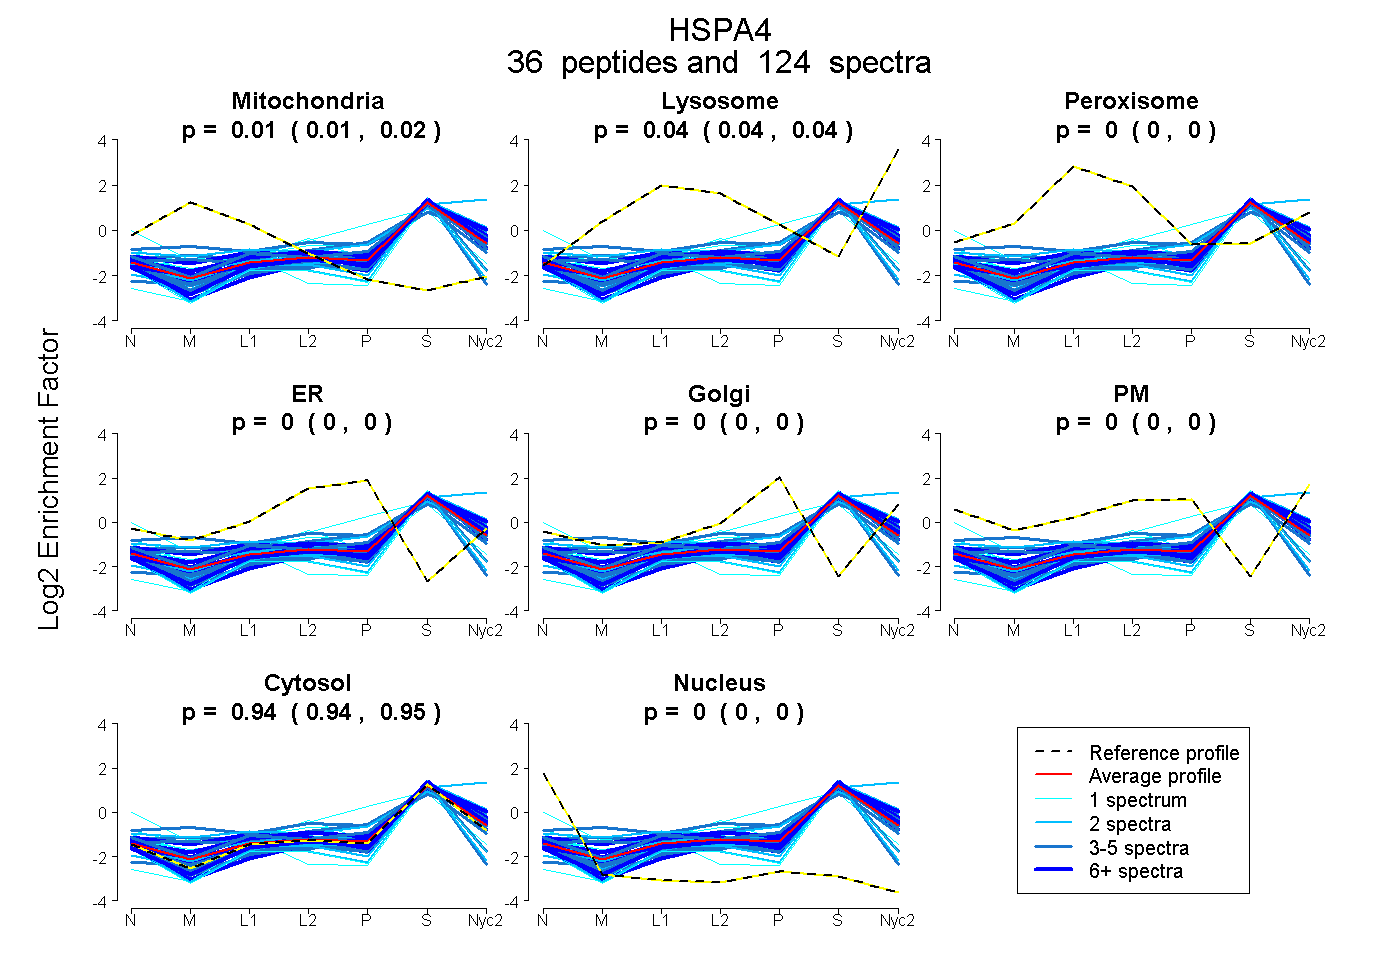
0.012 | 0.017
0.039 | 0.044
0.000 | 0.000
0.000 | 0.000
0.000 | 0.000
0.000 | 0.000
0.942 | 0.946
0.000 | 0.000
13peptides
spectra
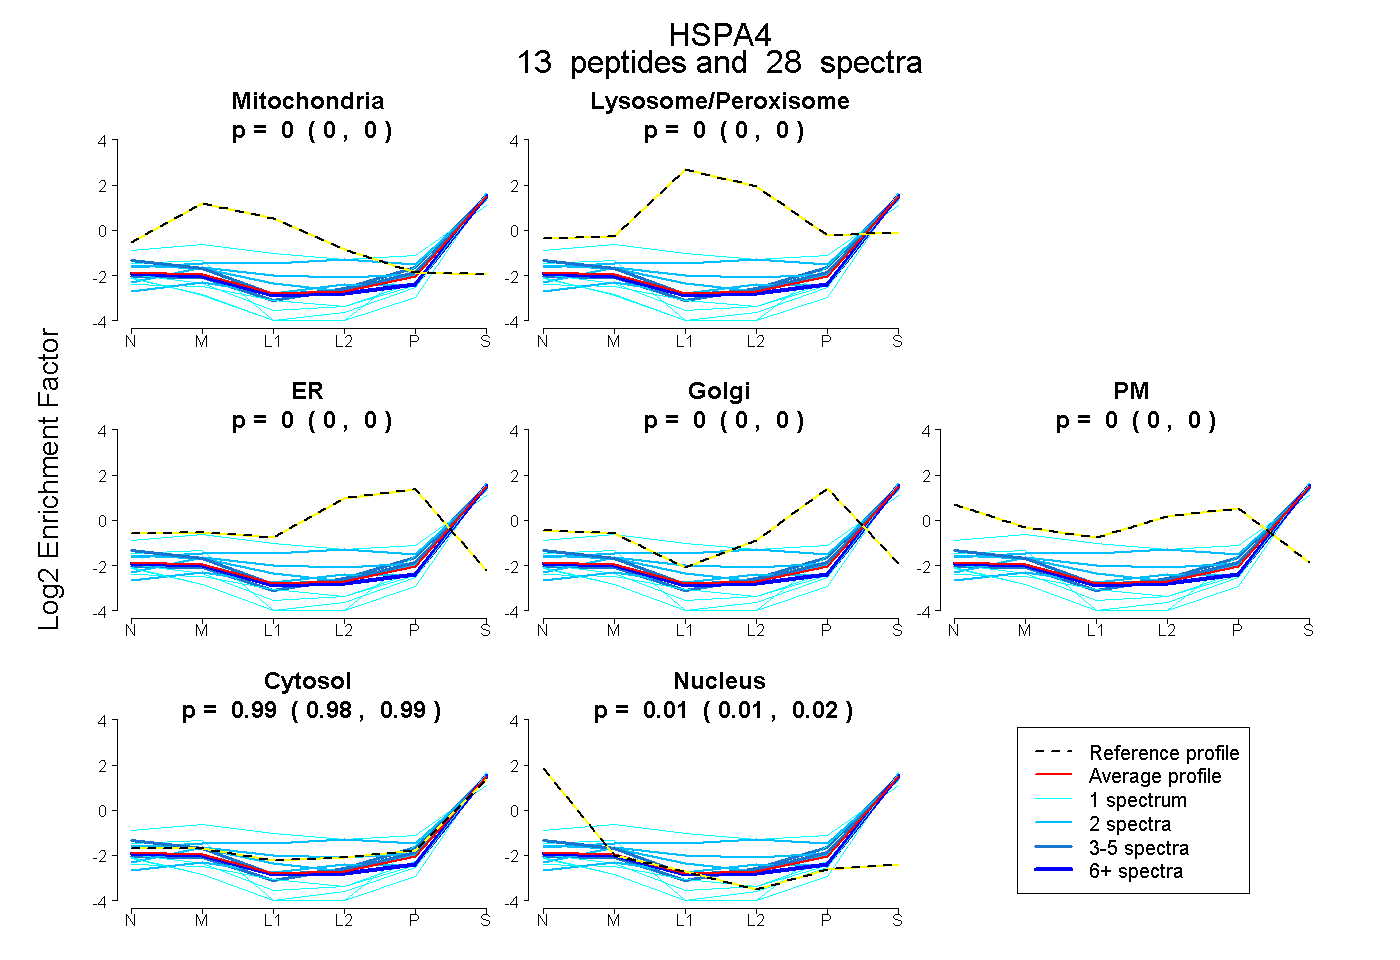
0.000 | 0.000
0.000 | 0.000
0.000 | 0.000
0.000 | 0.000
0.000 | 0.000
0.980 | 0.993
0.006 | 0.018
27peptides
spectra
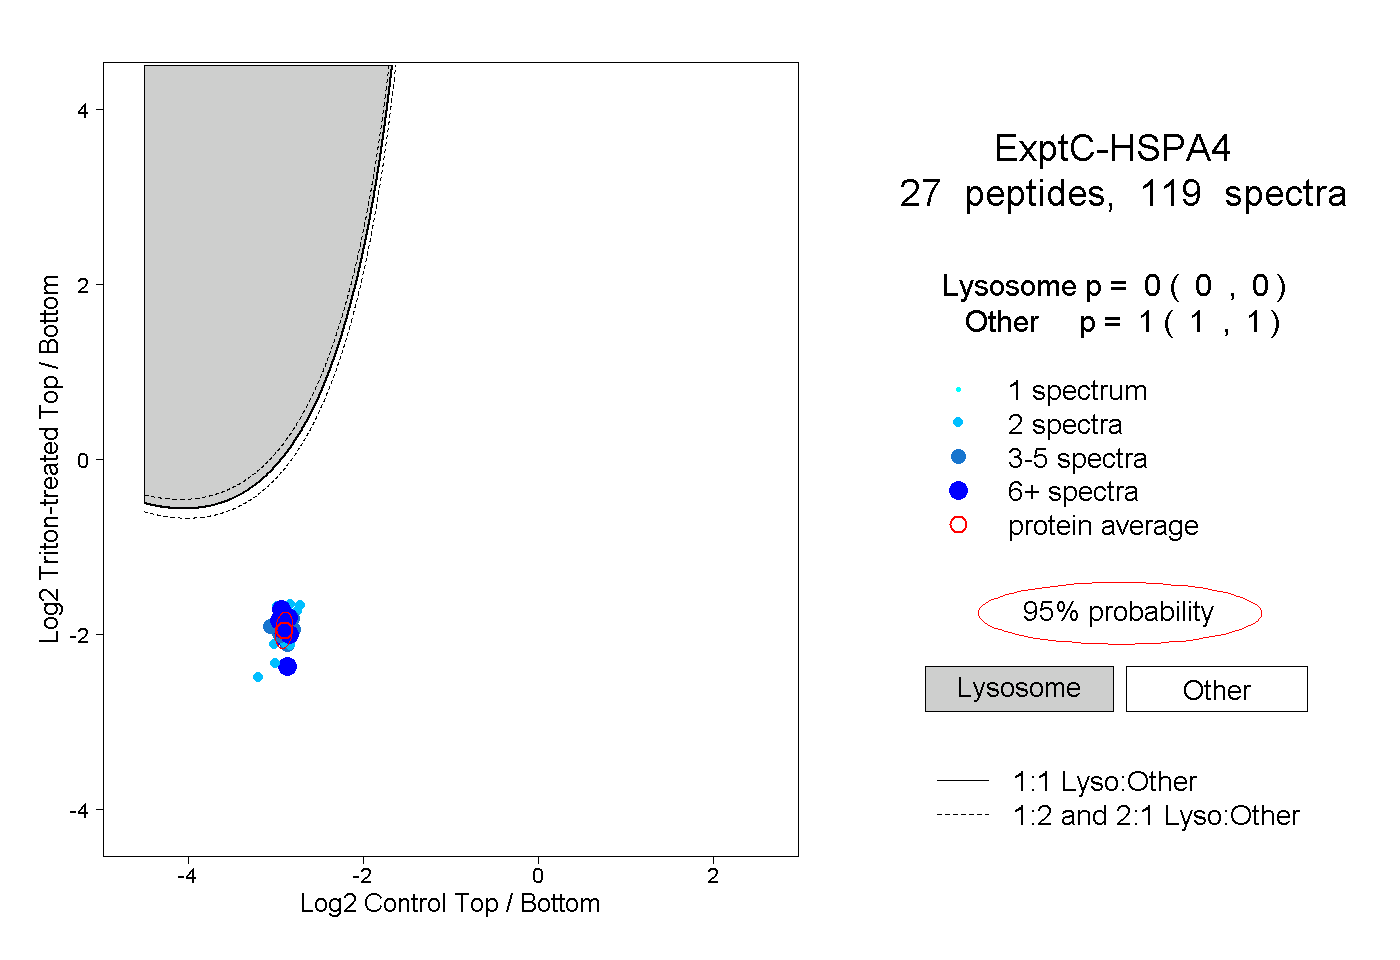
0.000 | 0.000
1.000 | 1.000
10peptides
spectra
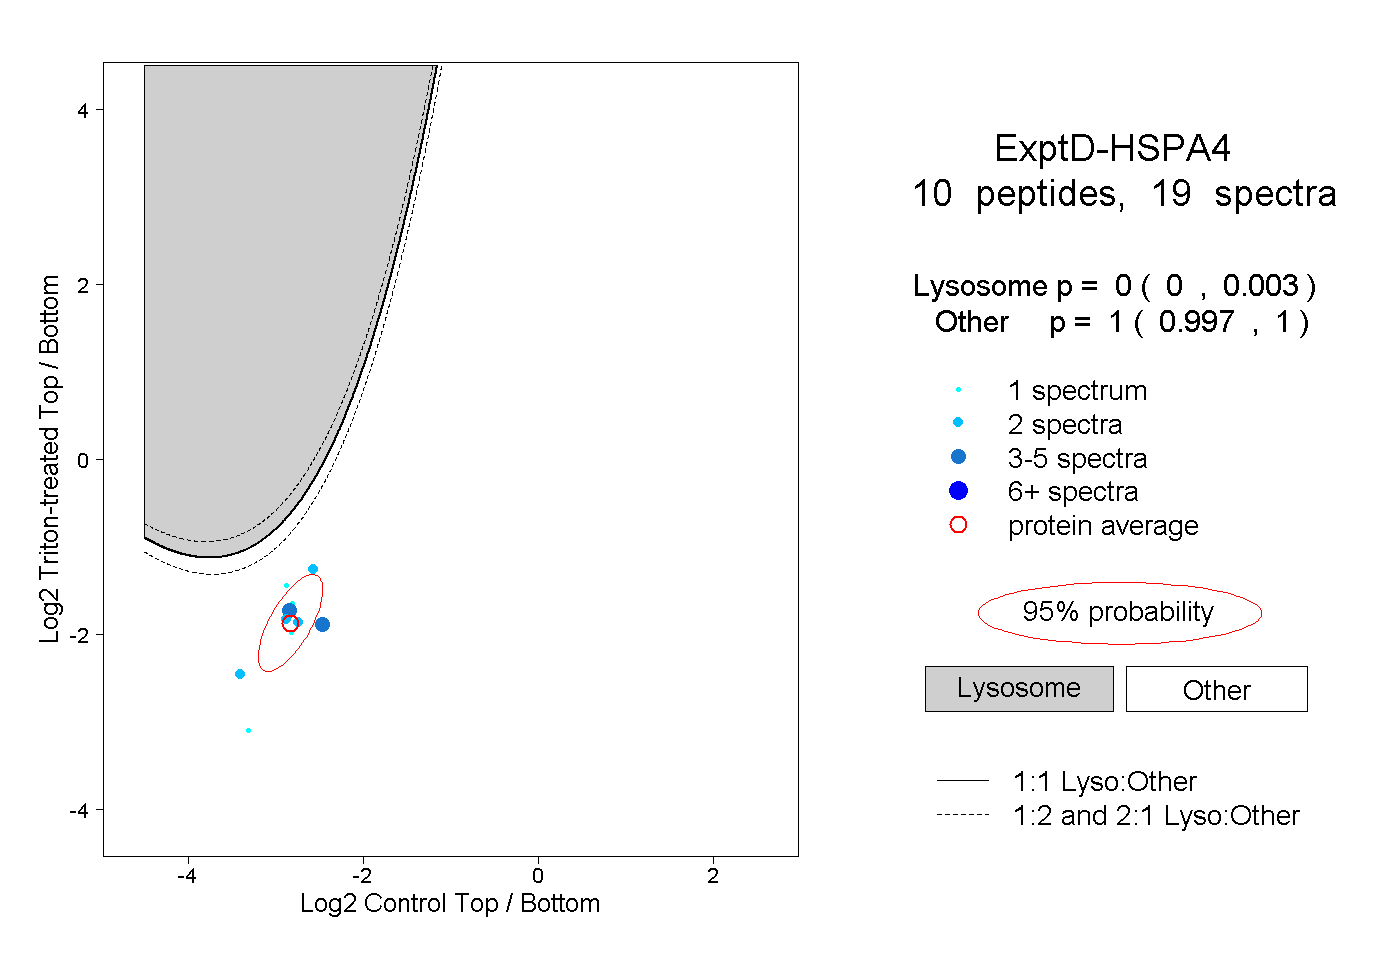
0.000 | 0.003
0.997 | 1.000