 36
36peptides
spectra
0.012 | 0.017
0.039 | 0.044
0.000 | 0.000
0.000 | 0.000
0.000 | 0.000
0.000 | 0.000
0.942 | 0.946
0.000 | 0.000
| Plot | Mito | Lyso | Perox | ER | Golgi | PM | Cytosol | Nucleus | |||||
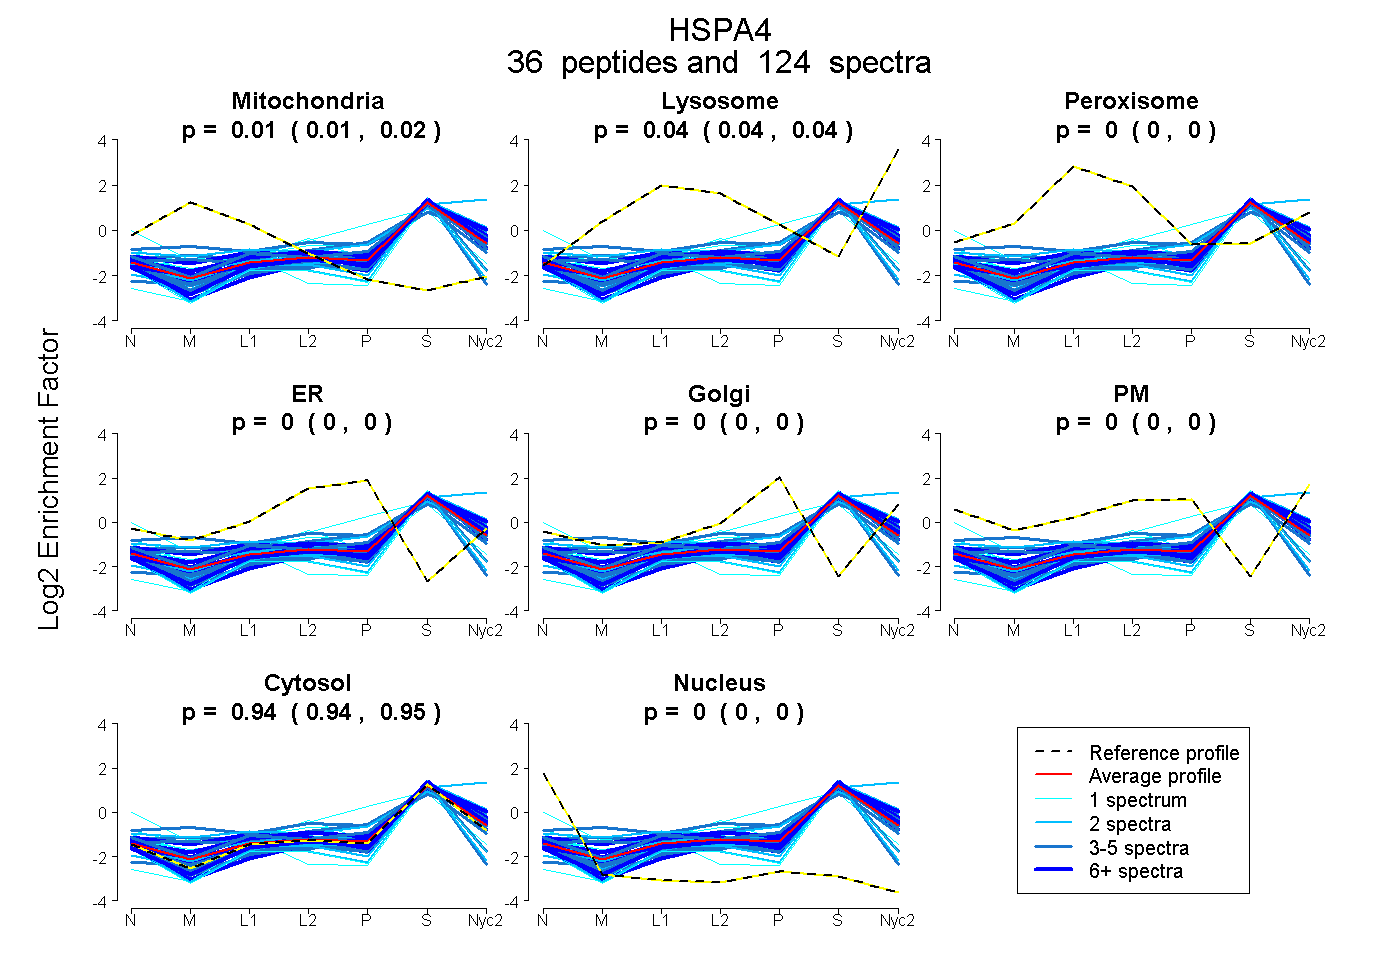
| Expt A |
36 peptides |
124 spectra |
|
0.015 0.012 | 0.017 |
0.042 0.039 | 0.044 |
0.000 0.000 | 0.000 |
0.000 0.000 | 0.000 |
0.000 0.000 | 0.000 |
0.000 0.000 | 0.000 |
0.944 0.942 | 0.946 |
0.000 0.000 | 0.000 |
| 1 spectrum, NVVFVDMGHSAYQVSVCAFNR | 0.000 | 0.000 | 0.000 | 0.000 | 0.000 | 0.000 | 1.000 | 0.000 | ||
| 7 spectra, VLATAFDTTLGGR | 0.000 | 0.065 | 0.000 | 0.000 | 0.000 | 0.000 | 0.935 | 0.000 | ||
| 1 spectrum, KPVVDCVVSVPSFYTDAER | 0.178 | 0.000 | 0.000 | 0.000 | 0.000 | 0.000 | 0.809 | 0.013 | ||
| 4 spectra, TLGQPIK | 0.114 | 0.046 | 0.000 | 0.000 | 0.000 | 0.000 | 0.840 | 0.000 | ||
| 7 spectra, NAVEEYVYEMR | 0.088 | 0.106 | 0.000 | 0.000 | 0.000 | 0.000 | 0.806 | 0.000 | ||
| 5 spectra, AFSDPFVEAEK | 0.021 | 0.011 | 0.000 | 0.000 | 0.000 | 0.000 | 0.968 | 0.000 | ||
| 3 spectra, EDIYAVEIVGGATR | 0.000 | 0.045 | 0.000 | 0.000 | 0.000 | 0.000 | 0.955 | 0.000 | ||
| 2 spectra, STNEAMEWMNSK | 0.056 | 0.132 | 0.021 | 0.000 | 0.057 | 0.017 | 0.717 | 0.000 | ||
| 4 spectra, LSGEYEK | 0.082 | 0.000 | 0.036 | 0.061 | 0.063 | 0.000 | 0.757 | 0.000 | ||
| 1 spectrum, FVSEDDR | 0.000 | 0.096 | 0.000 | 0.000 | 0.000 | 0.147 | 0.757 | 0.000 | ||
| 2 spectra, QSLTADPVVK | 0.000 | 0.000 | 0.000 | 0.000 | 0.000 | 0.000 | 1.000 | 0.000 | ||
| 3 spectra, EMLGLYTENEGK | 0.000 | 0.000 | 0.000 | 0.000 | 0.004 | 0.000 | 0.996 | 0.000 | ||
| 6 spectra, LFEELGK | 0.000 | 0.000 | 0.000 | 0.000 | 0.000 | 0.000 | 0.981 | 0.019 | ||
| 8 spectra, VTYMEEER | 0.000 | 0.000 | 0.000 | 0.000 | 0.000 | 0.000 | 1.000 | 0.000 | ||
| 3 spectra, VTPQSDGSSSK | 0.000 | 0.079 | 0.000 | 0.000 | 0.014 | 0.030 | 0.877 | 0.000 | ||
| 2 spectra, NFTTEQVTAMLLSK | 0.000 | 0.067 | 0.000 | 0.000 | 0.000 | 0.000 | 0.933 | 0.000 | ||
| 6 spectra, TDQPPQAK | 0.000 | 0.094 | 0.008 | 0.000 | 0.000 | 0.000 | 0.899 | 0.000 | ||
| 6 spectra, AGGIETIANEYSDR | 0.007 | 0.038 | 0.000 | 0.000 | 0.000 | 0.000 | 0.955 | 0.000 | ||
| 2 spectra, FQESEERPK | 0.000 | 0.274 | 0.000 | 0.000 | 0.000 | 0.000 | 0.726 | 0.000 | ||
| 5 spectra, SVGAAAK | 0.000 | 0.000 | 0.000 | 0.000 | 0.028 | 0.000 | 0.972 | 0.000 | ||
| 2 spectra, EFSITDVVPYPISLR | 0.000 | 0.000 | 0.000 | 0.000 | 0.000 | 0.000 | 0.997 | 0.003 | ||
| 1 spectrum, AESEEMETSQAGSK | 0.023 | 0.000 | 0.207 | 0.004 | 0.000 | 0.000 | 0.609 | 0.158 | ||
| 2 spectra, SVMDATQIAGLNCLR | 0.044 | 0.000 | 0.000 | 0.000 | 0.000 | 0.000 | 0.880 | 0.076 | ||
| 3 spectra, FLEMCDDLLAR | 0.003 | 0.000 | 0.000 | 0.000 | 0.000 | 0.000 | 0.946 | 0.051 | ||
| 1 spectrum, ELSTTLNADEAVTR | 0.059 | 0.064 | 0.000 | 0.000 | 0.000 | 0.000 | 0.877 | 0.000 | ||
| 3 spectra, QIQQYMK | 0.000 | 0.131 | 0.000 | 0.000 | 0.000 | 0.017 | 0.851 | 0.000 | ||
| 1 spectrum, SNLAYDIVQLPTGLTGIK | 0.000 | 0.000 | 0.000 | 0.000 | 0.000 | 0.000 | 0.983 | 0.017 | ||
| 10 spectra, VLTFYR | 0.000 | 0.149 | 0.000 | 0.000 | 0.000 | 0.000 | 0.851 | 0.000 | ||
| 3 spectra, NHAAPFSK | 0.082 | 0.138 | 0.016 | 0.000 | 0.000 | 0.119 | 0.646 | 0.000 | ||
| 1 spectrum, FDEVLVNHFCEEFGK | 0.000 | 0.000 | 0.000 | 0.271 | 0.000 | 0.000 | 0.729 | 0.000 | ||
| 3 spectra, QDLPALEEKPR | 0.000 | 0.000 | 0.000 | 0.000 | 0.000 | 0.000 | 0.978 | 0.022 | ||
| 2 spectra, VISSFK | 0.024 | 0.077 | 0.000 | 0.000 | 0.003 | 0.000 | 0.896 | 0.000 | ||
| 4 spectra, VEPPLR | 0.000 | 0.000 | 0.000 | 0.000 | 0.034 | 0.000 | 0.966 | 0.000 | ||
| 5 spectra, LSQECEK | 0.000 | 0.000 | 0.000 | 0.000 | 0.000 | 0.000 | 0.882 | 0.118 | ||
| 2 spectra, SQVISNAK | 0.011 | 0.026 | 0.000 | 0.000 | 0.000 | 0.000 | 0.963 | 0.000 | ||
| 3 spectra, LNLQNK | 0.000 | 0.040 | 0.000 | 0.000 | 0.000 | 0.000 | 0.960 | 0.000 |
| Plot | Mito | Lyso or Perox | ER | Golgi | PM | Cytosol | Nucleus | ||||||
| Expt B |
13 peptides |
28 spectra |
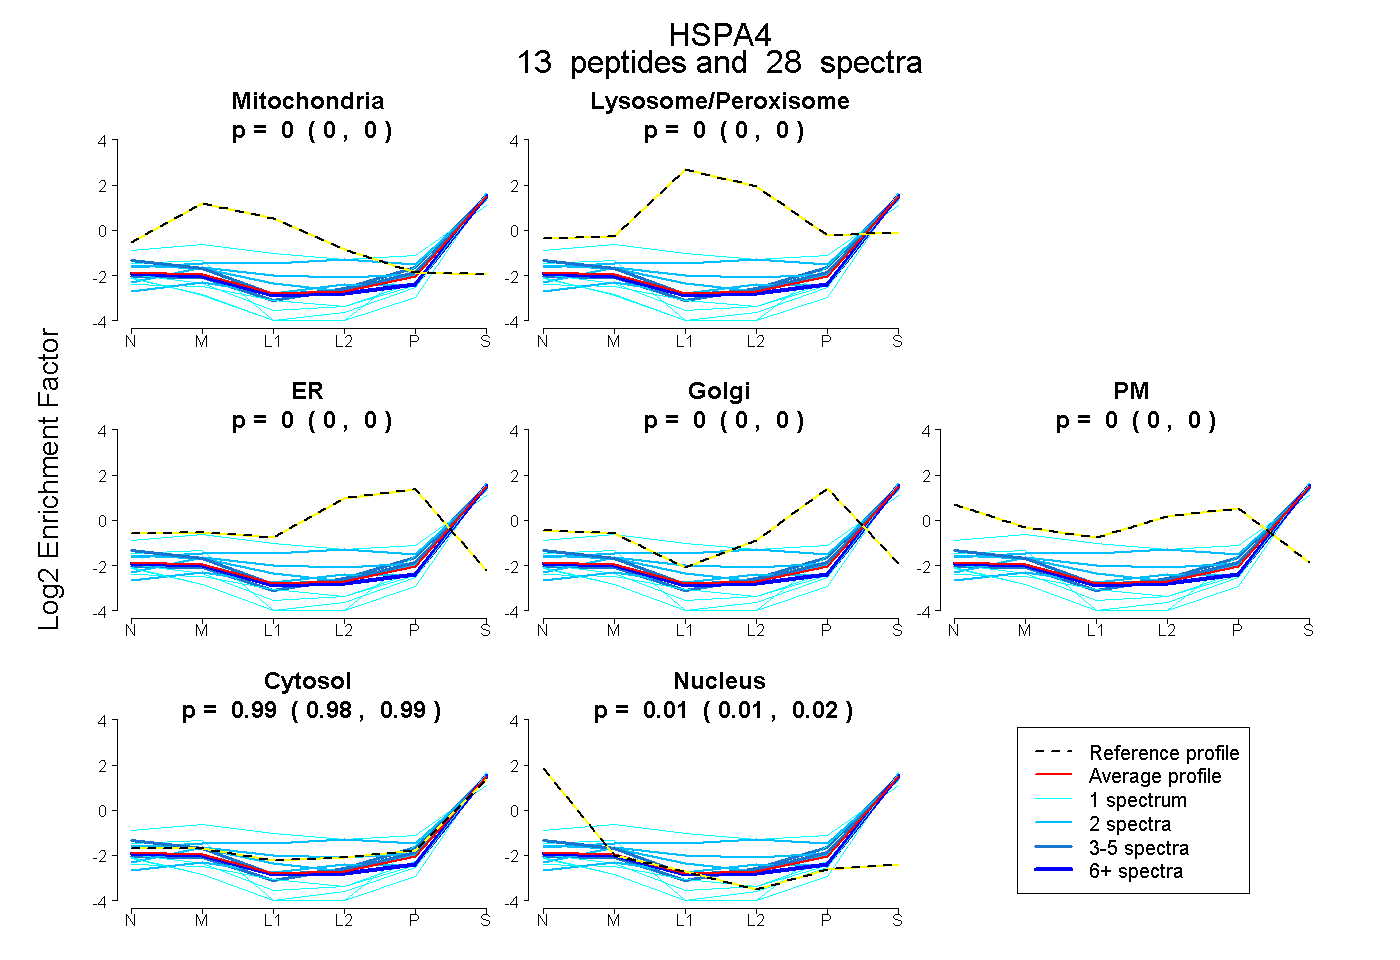 |
0.000 0.000 | 0.000 |
0.000 0.000 | 0.000 |
0.000 0.000 | 0.000 |
0.000 0.000 | 0.000 |
0.000 0.000 | 0.000 |
0.987 0.980 | 0.993 |
0.013 0.006 | 0.018 |
|||
| Plot | Lyso | Other | |||||||||||
| Expt C |
27 peptides |
119 spectra |
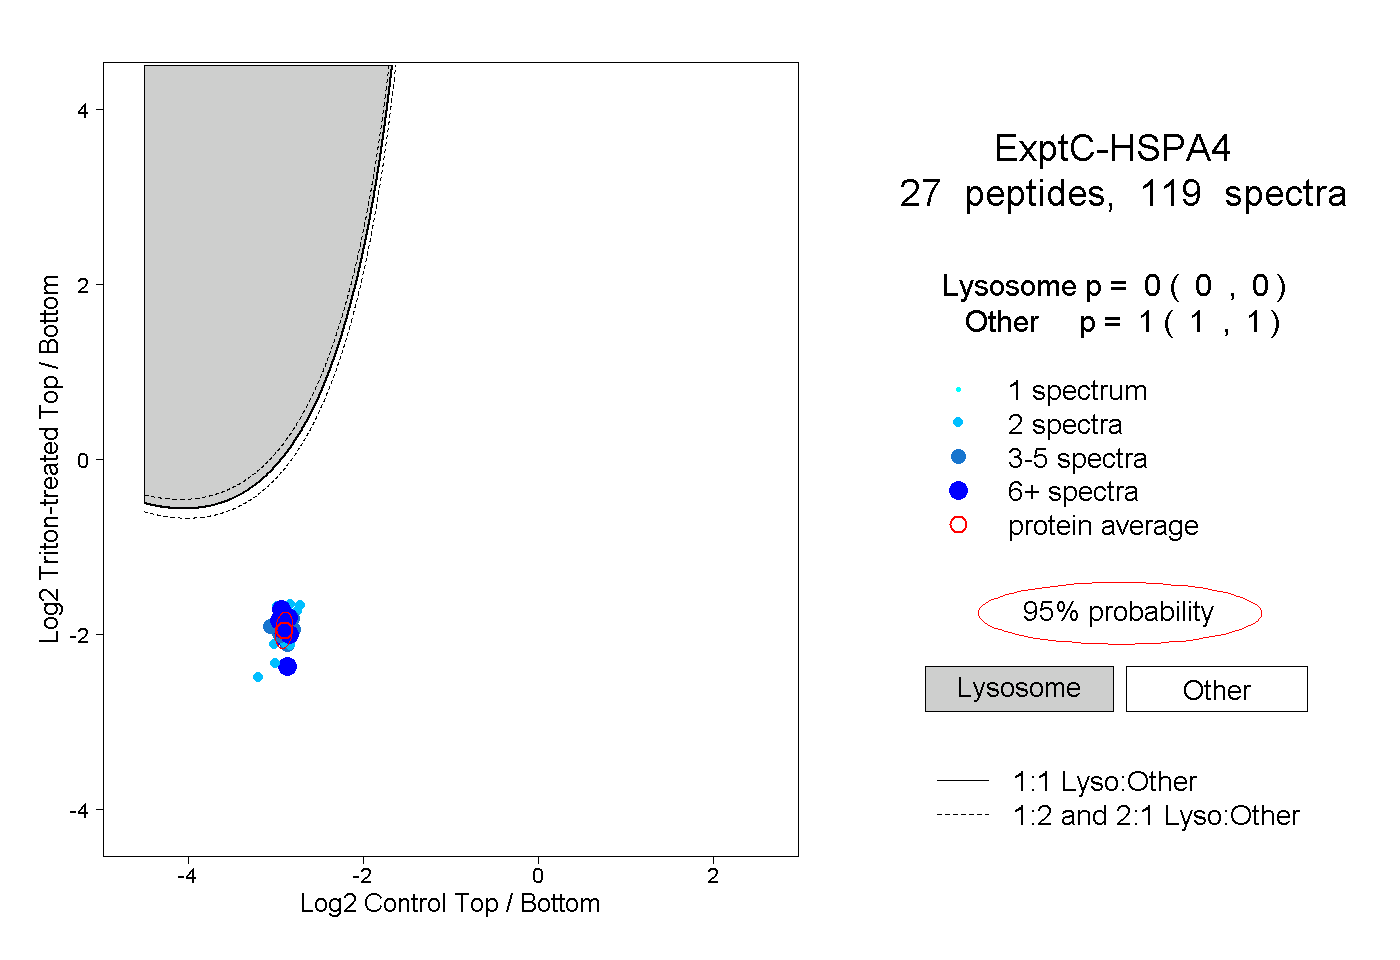 |
0.000 0.000 | 0.000 |
1.000 1.000 | 1.000 |
||||||||
| Plot | Lyso | Other | |||||||||||
| Expt D |
10 peptides |
19 spectra |
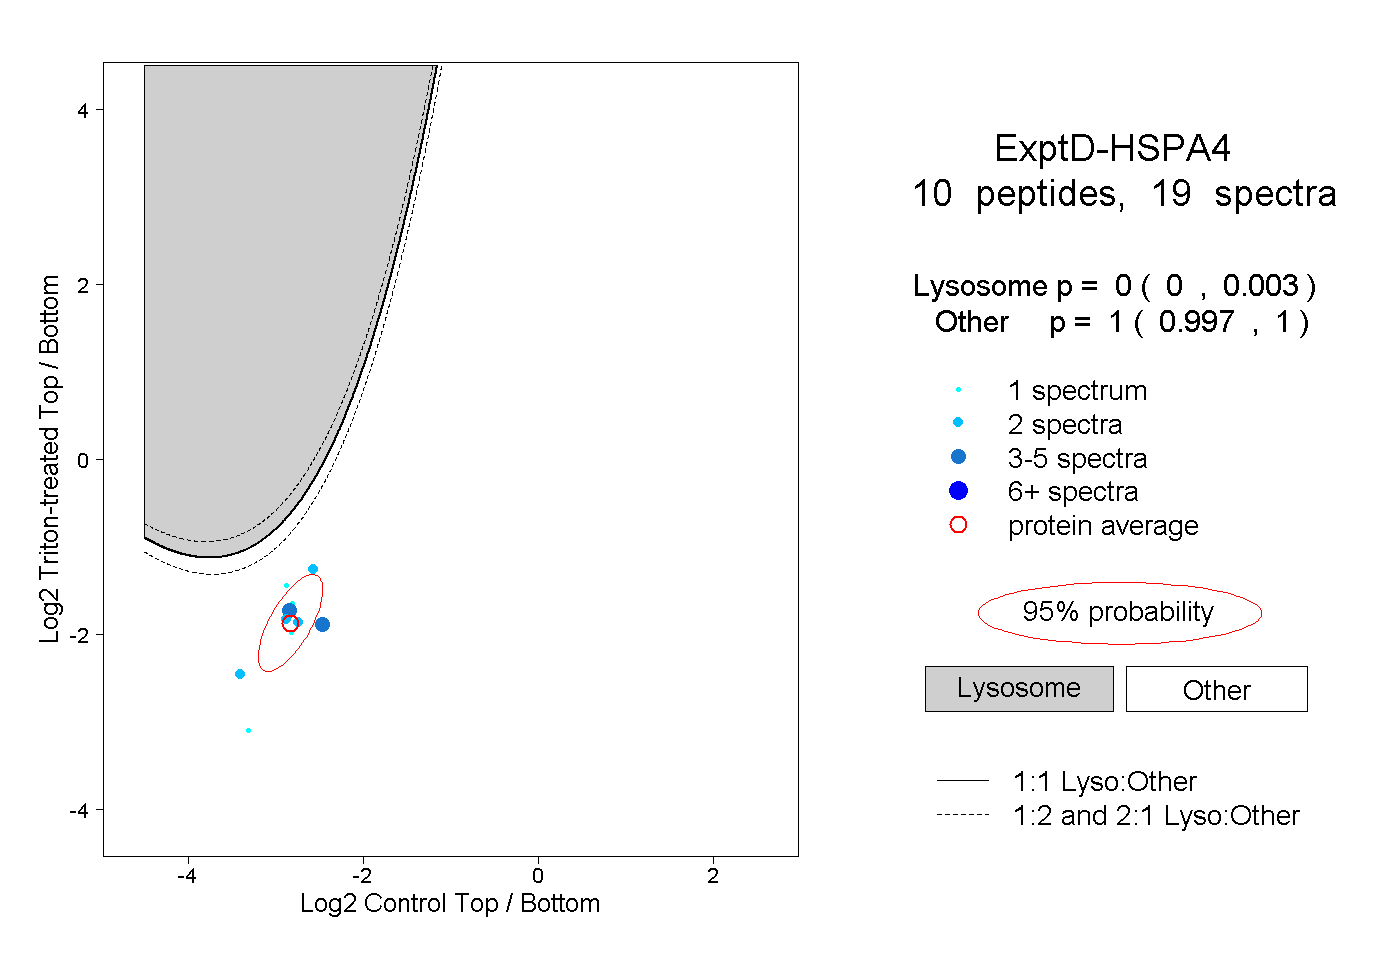 |
0.000 0.000 | 0.003 |
1.000 0.997 | 1.000 |