 5
5peptides
spectra
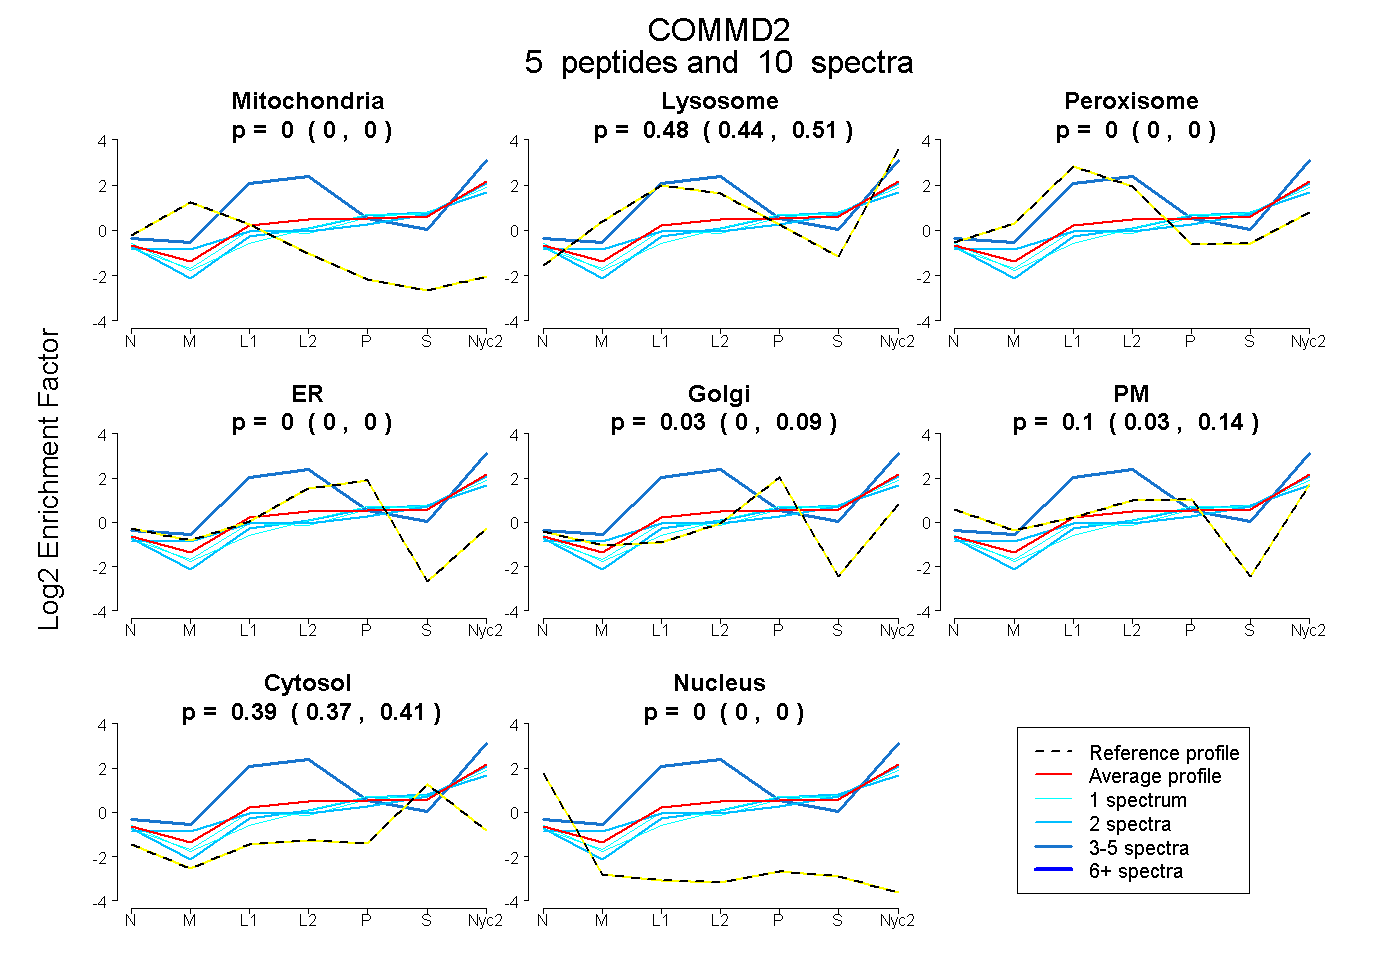
0.000 | 0.000
0.437 | 0.510
0.000 | 0.000
0.000 | 0.000
0.000 | 0.087
0.032 | 0.140
0.373 | 0.410
0.000 | 0.000
4peptides
spectra
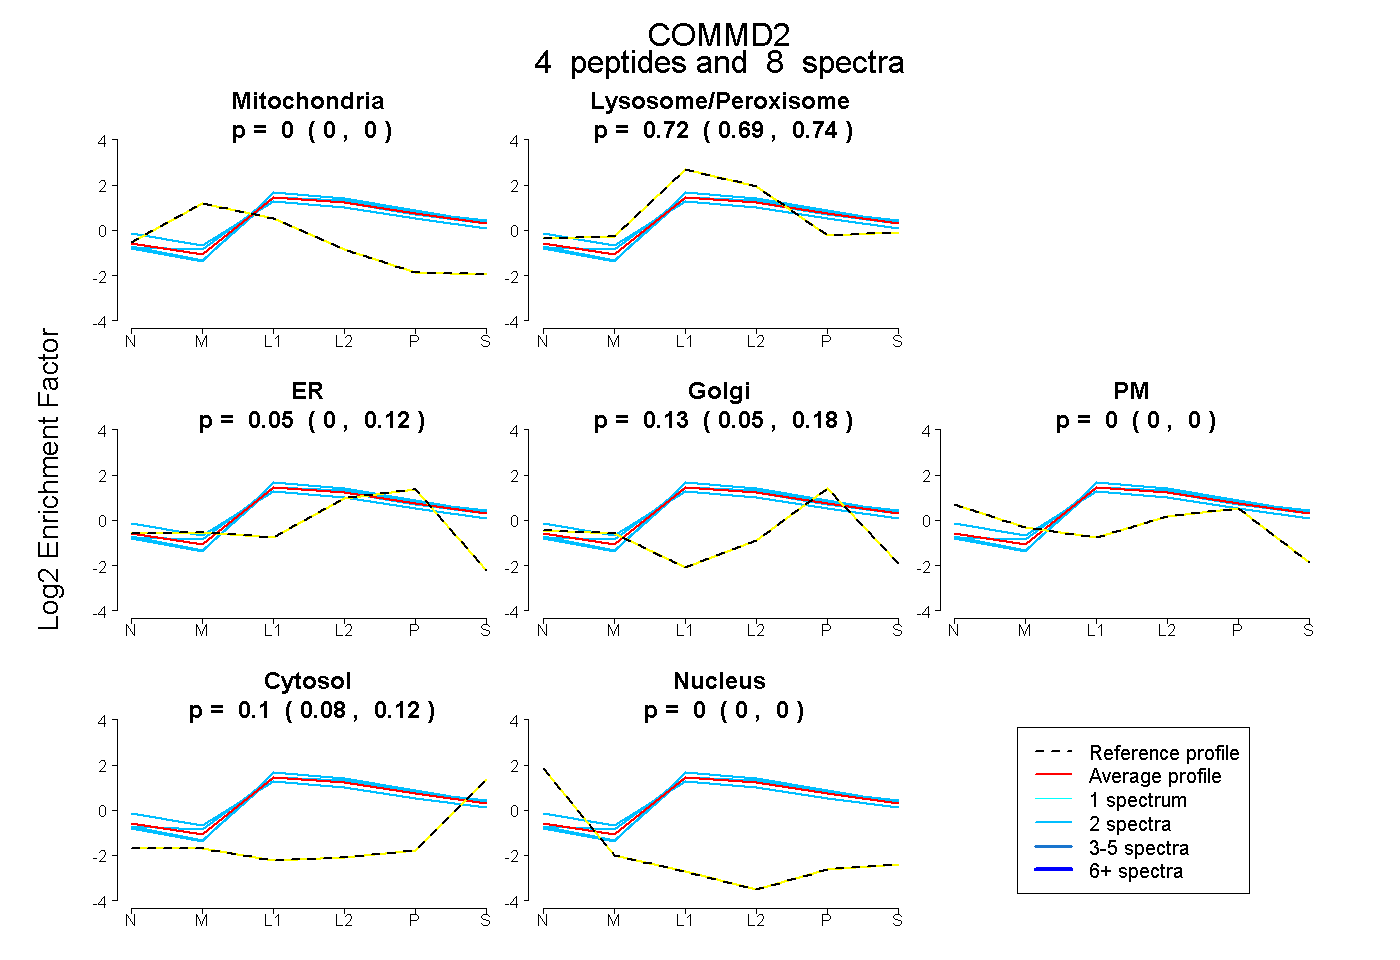
0.000 | 0.000
0.693 | 0.743
0.000 | 0.118
0.052 | 0.178
0.000 | 0.000
0.076 | 0.120
0.000 | 0.000
6peptides
spectra
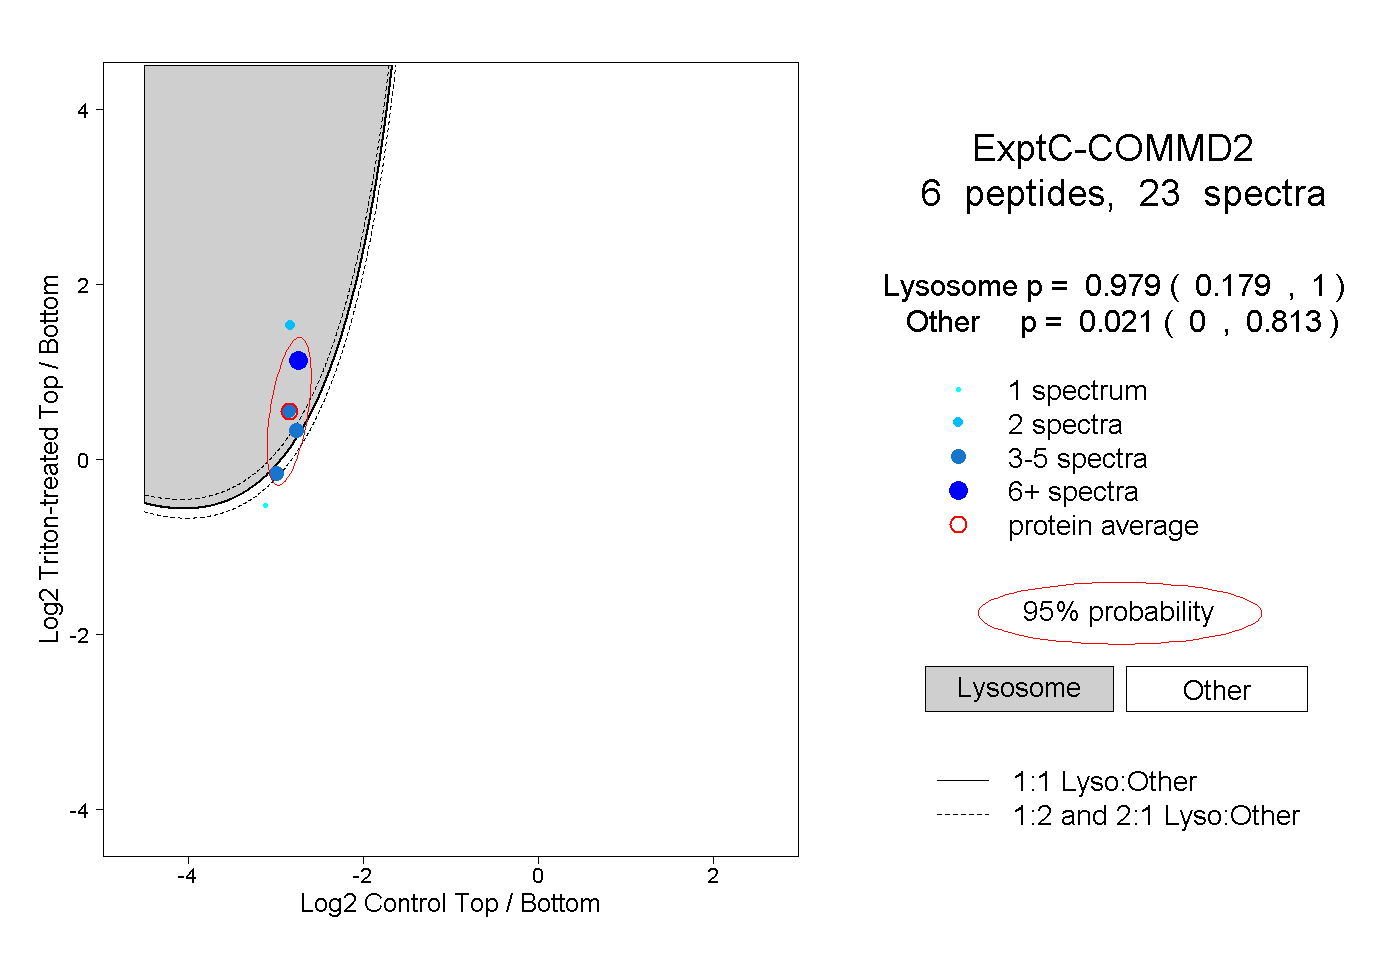
0.179 | 1.000
0.000 | 0.813
1peptide
spectrum
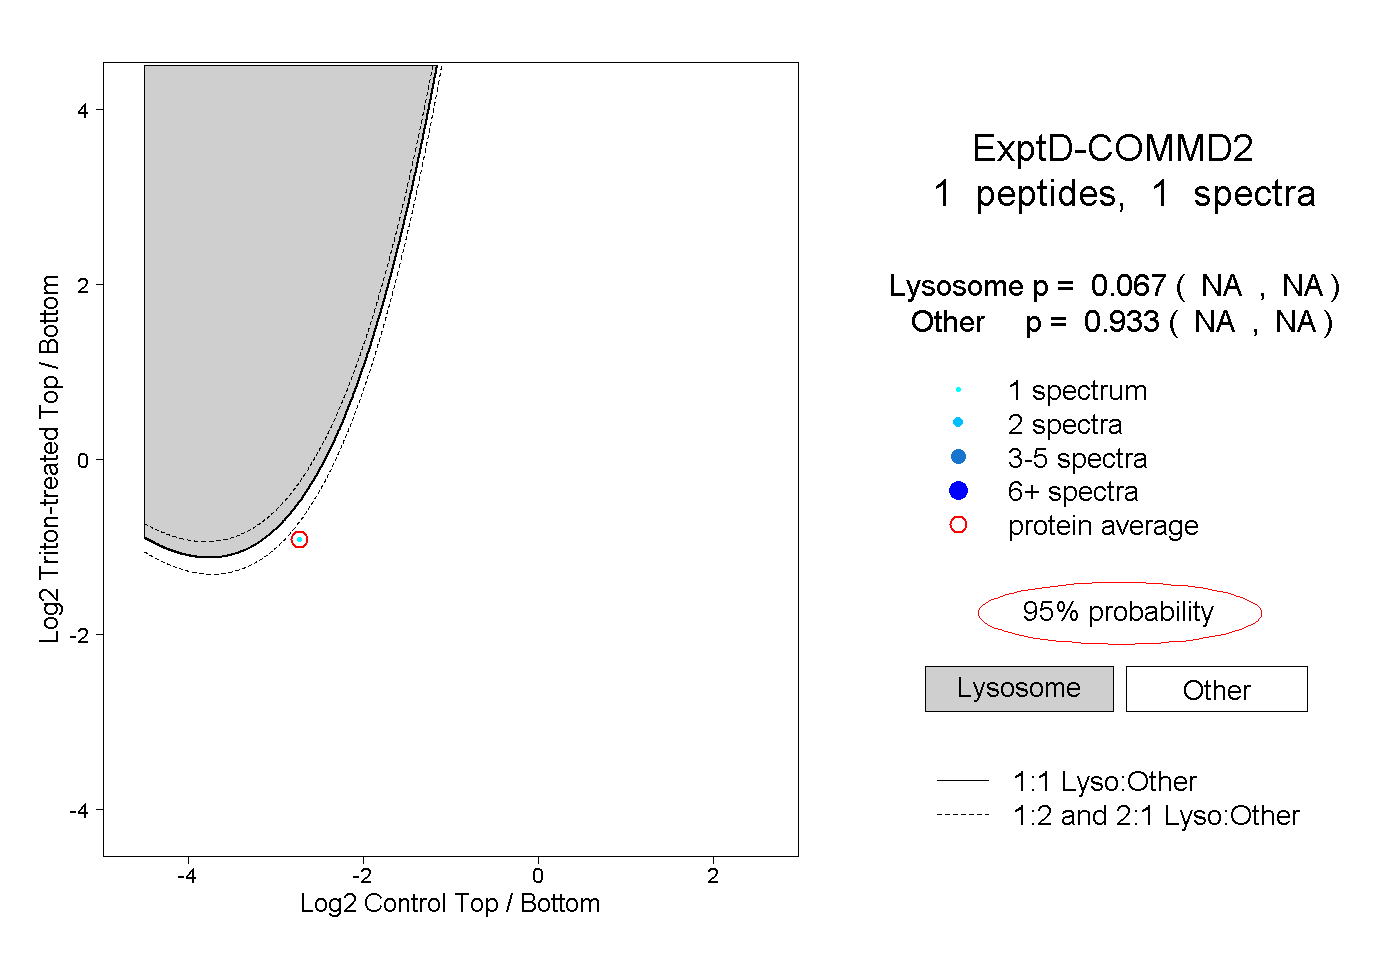
NA | NA
NA | NA