 5
5peptides
spectra
0.000 | 0.000
0.437 | 0.510
0.000 | 0.000
0.000 | 0.000
0.000 | 0.087
0.032 | 0.140
0.373 | 0.410
0.000 | 0.000
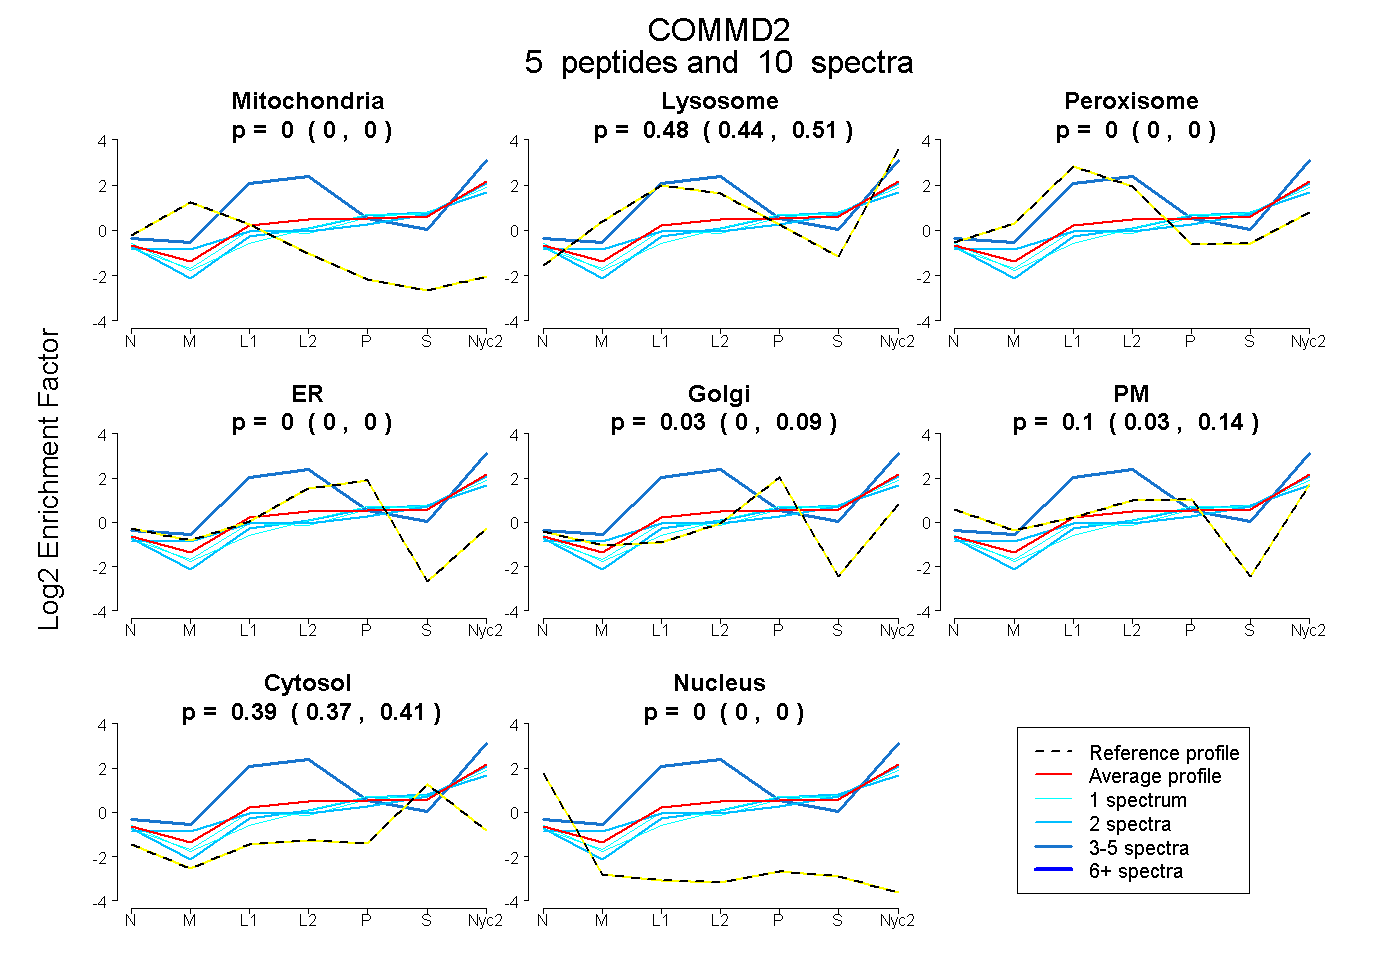
| Plot | Mito | Lyso | Perox | ER | Golgi | PM | Cytosol | Nucleus | |||||
| Expt A |
5 peptides |
10 spectra |
|
0.000 0.000 | 0.000 |
0.475 0.437 | 0.510 |
0.000 0.000 | 0.000 |
0.000 0.000 | 0.000 |
0.035 0.000 | 0.087 |
0.097 0.032 | 0.140 |
0.394 0.373 | 0.410 |
0.000 0.000 | 0.000 |
| 1 spectrum, QQMKPAVTIK | 0.000 | 0.404 | 0.000 | 0.000 | 0.131 | 0.000 | 0.465 | 0.000 | ||
| 4 spectra, IYEGAAR | 0.000 | 0.659 | 0.276 | 0.000 | 0.000 | 0.047 | 0.018 | 0.000 | ||
| 2 spectra, IAVEFLR | 0.000 | 0.335 | 0.000 | 0.000 | 0.179 | 0.000 | 0.486 | 0.000 | ||
| 2 spectra, TILNELAPR | 0.000 | 0.487 | 0.000 | 0.000 | 0.076 | 0.000 | 0.437 | 0.000 | ||
| 1 spectrum, LDVQLASR | 0.000 | 0.357 | 0.000 | 0.000 | 0.212 | 0.000 | 0.432 | 0.000 |
| Plot | Mito | Lyso or Perox | ER | Golgi | PM | Cytosol | Nucleus | ||||||
| Expt B |
4 peptides |
8 spectra |
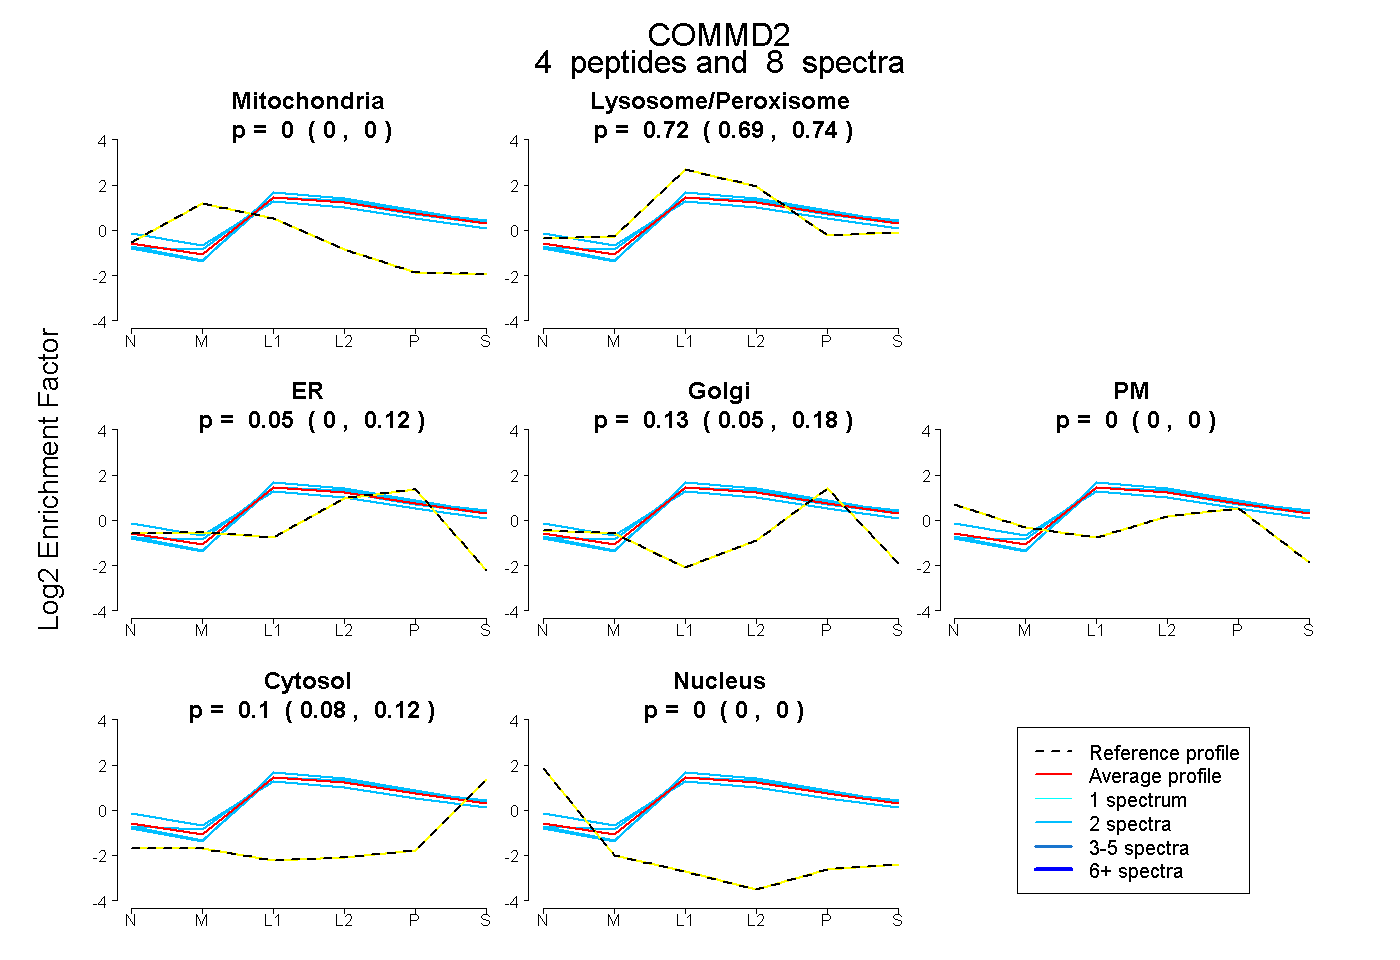 |
0.000 0.000 | 0.000 |
0.723 0.693 | 0.743 |
0.052 0.000 | 0.118 |
0.127 0.052 | 0.178 |
0.000 0.000 | 0.000 |
0.098 0.076 | 0.120 |
0.000 0.000 | 0.000 |
|||
| Plot | Lyso | Other | |||||||||||
| Expt C |
6 peptides |
23 spectra |
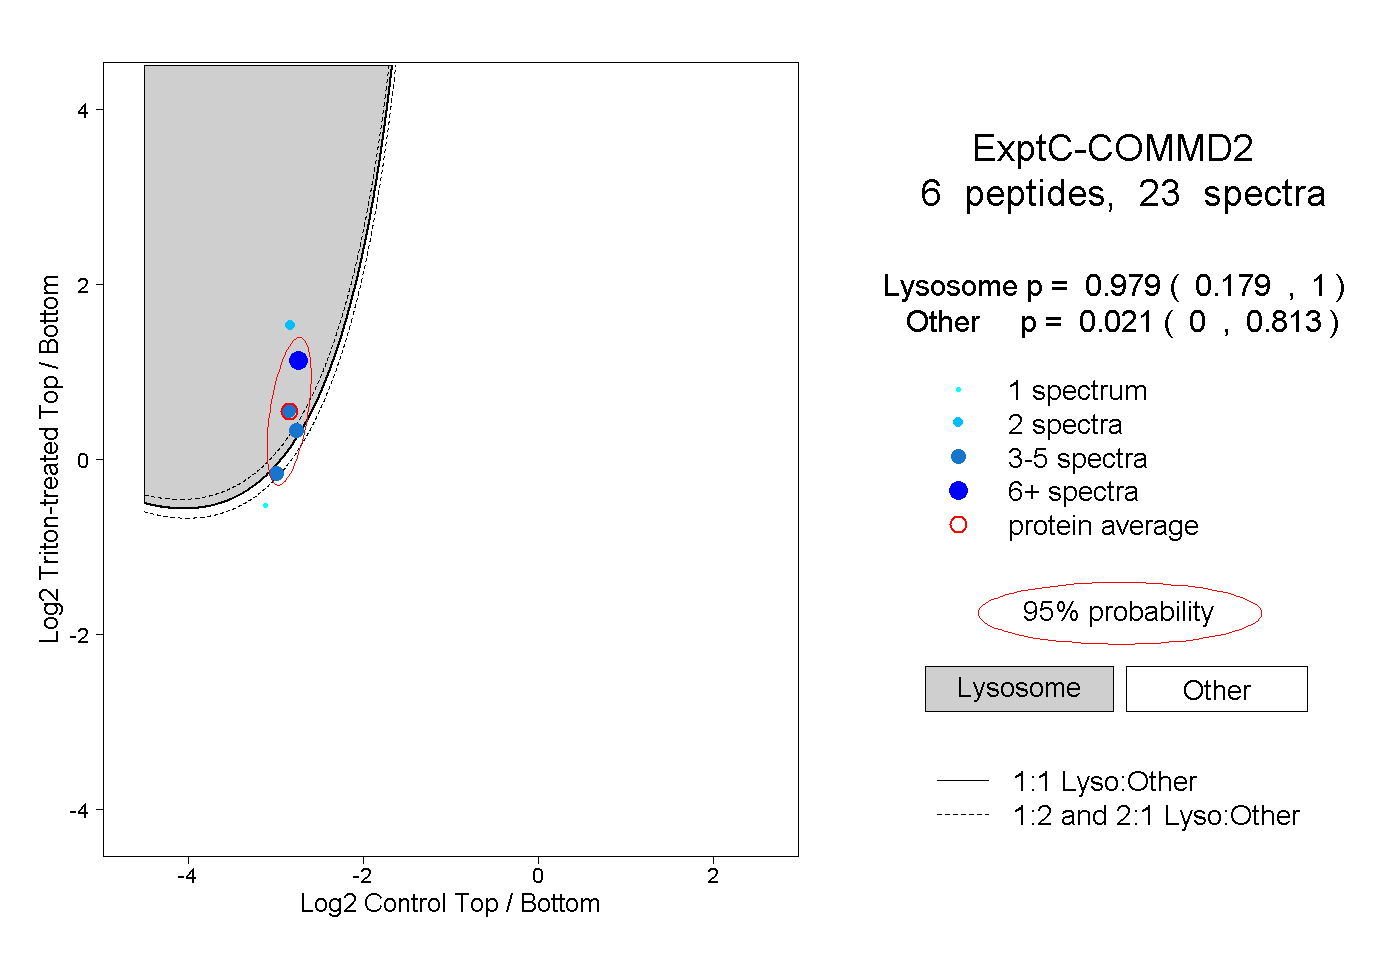 |
0.979 0.179 | 1.000 |
0.021 0.000 | 0.813 |
||||||||
| Plot | Lyso | Other | |||||||||||
| Expt D |
1 peptide |
1 spectrum |
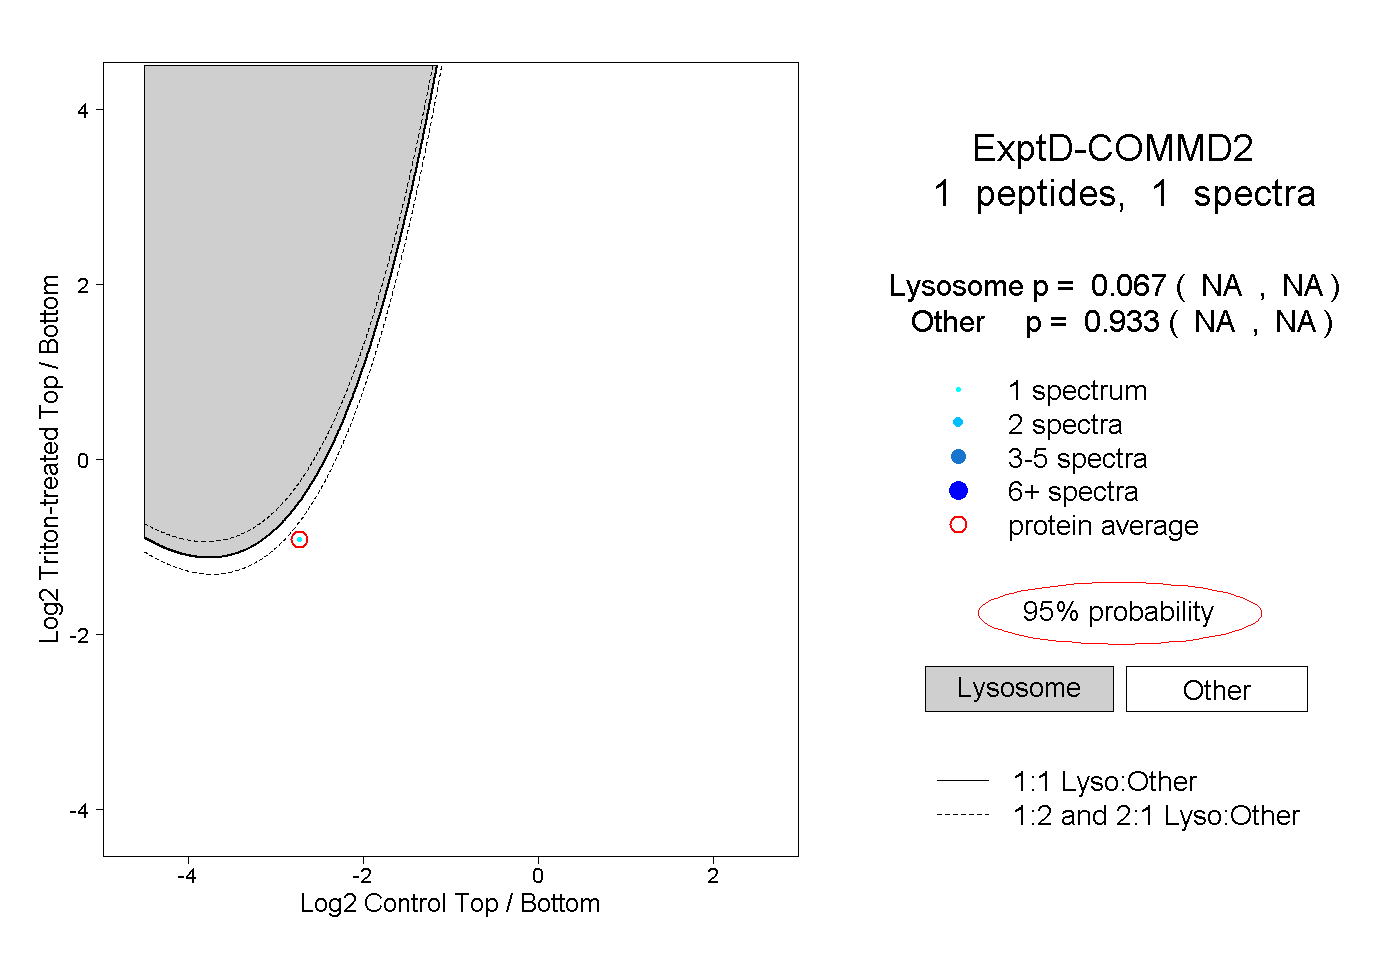 |
0.067 NA | NA |
0.933 NA | NA |