COMMD2
[ENSRNOP00000022778]
Main page
| | | Plot |
Mito |
Lyso |
|
Perox |
ER |
Golgi |
PM |
Cytosol |
Nucleus |
|
| Expt A |
 5
5
peptides |
10
spectra |
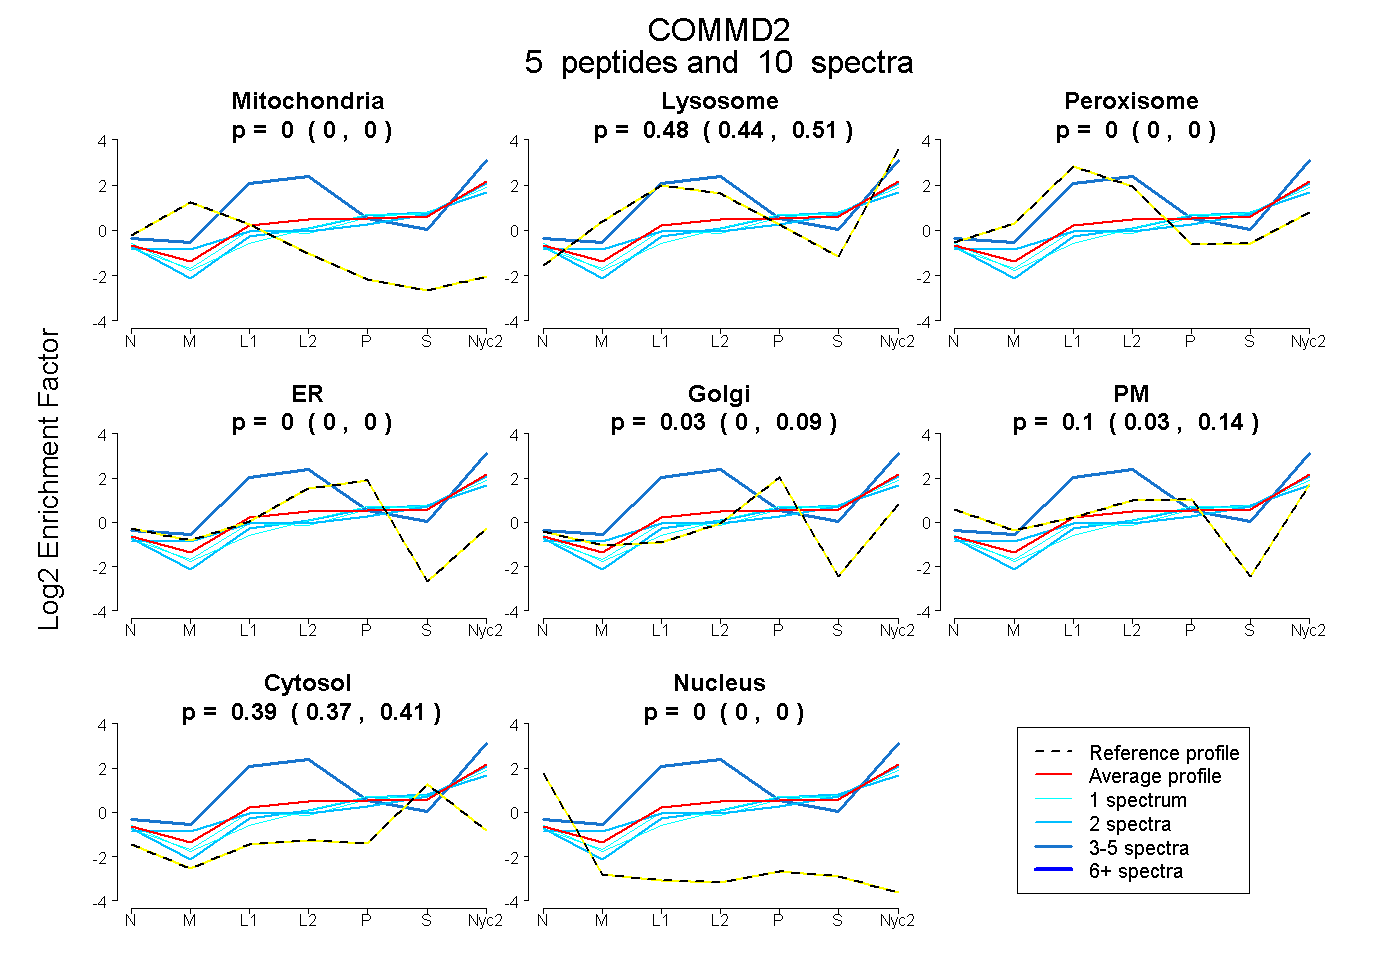 |
0.000
0.000 | 0.000 |
0.475
0.437 | 0.510 |
|
0.000
0.000 | 0.000 |
0.000
0.000 | 0.000 |
0.035
0.000 | 0.087 |
0.097
0.032 | 0.140 |
0.394
0.373 | 0.410 |
0.000
0.000 | 0.000 |
|
| | | Plot |
Mito |
|
Lyso or Perox |
|
ER |
Golgi |
PM |
Cytosol |
Nucleus |
|
| Expt B |
4
peptides |
8
spectra |
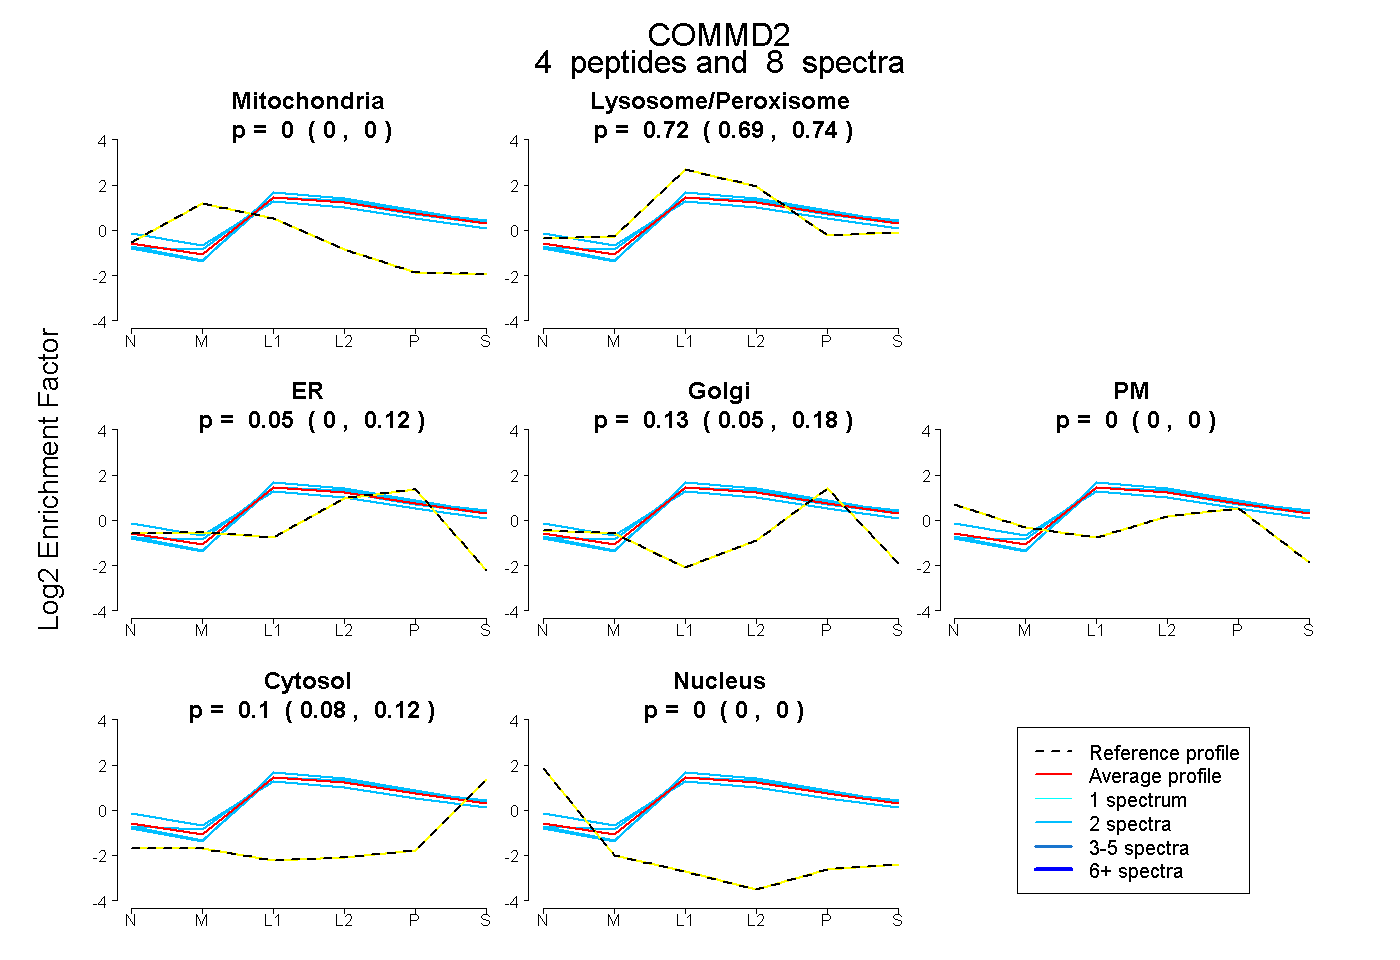 |
0.000
0.000 | 0.000 |
|
0.723
0.693 | 0.743 |
|
0.052
0.000 | 0.118 |
0.127
0.052 | 0.178 |
0.000
0.000 | 0.000 |
0.098
0.076 | 0.120 |
0.000
0.000 | 0.000 |
|
| 2 spectra, IYEGAAR |
0.000 |
|
0.706 |
|
0.000 |
0.226 |
0.000 |
0.068 |
0.000 |
|
| 2 spectra, IAVEFLR |
0.000 |
|
0.713 |
|
0.174 |
0.000 |
0.000 |
0.113 |
0.000 |
|
| 2 spectra, TILNELAPR |
0.000 |
|
0.728 |
|
0.036 |
0.139 |
0.000 |
0.097 |
0.000 |
|
| 2 spectra, LDVQLASR |
0.000 |
|
0.682 |
|
0.171 |
0.000 |
0.000 |
0.147 |
0.000 |
|
| | | Plot |
|
Lyso |
|
|
|
|
|
|
|
Other |
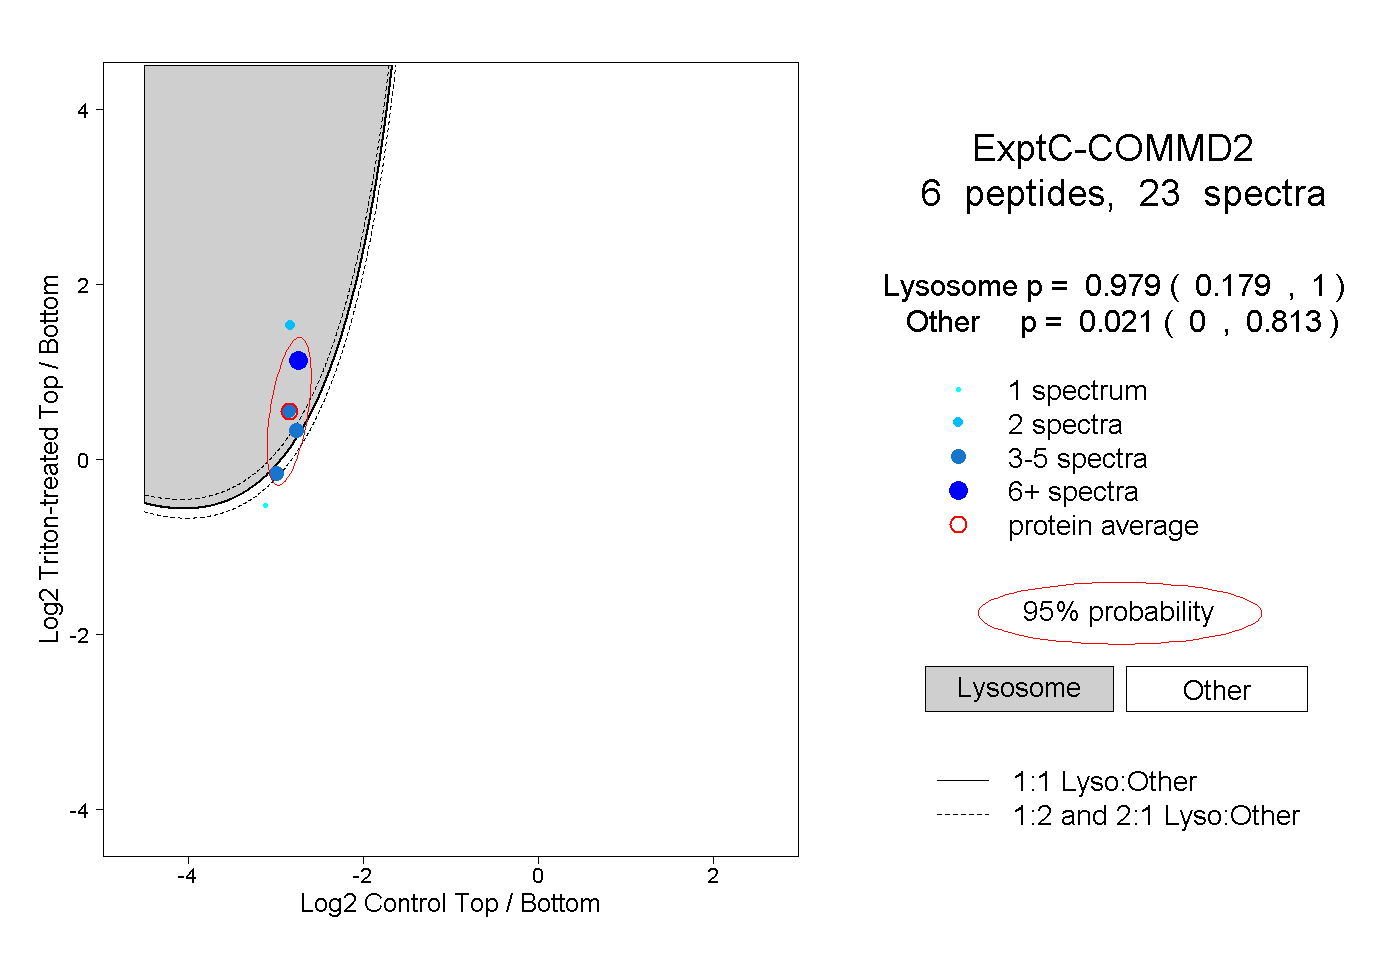
| Expt C |
6
peptides |
23
spectra |
 |
|
0.979
0.179 | 1.000 |
|
|
|
|
|
|
|
0.021
0.000 | 0.813 |
| | | Plot |
|
Lyso |
|
|
|
|
|
|
|
Other |
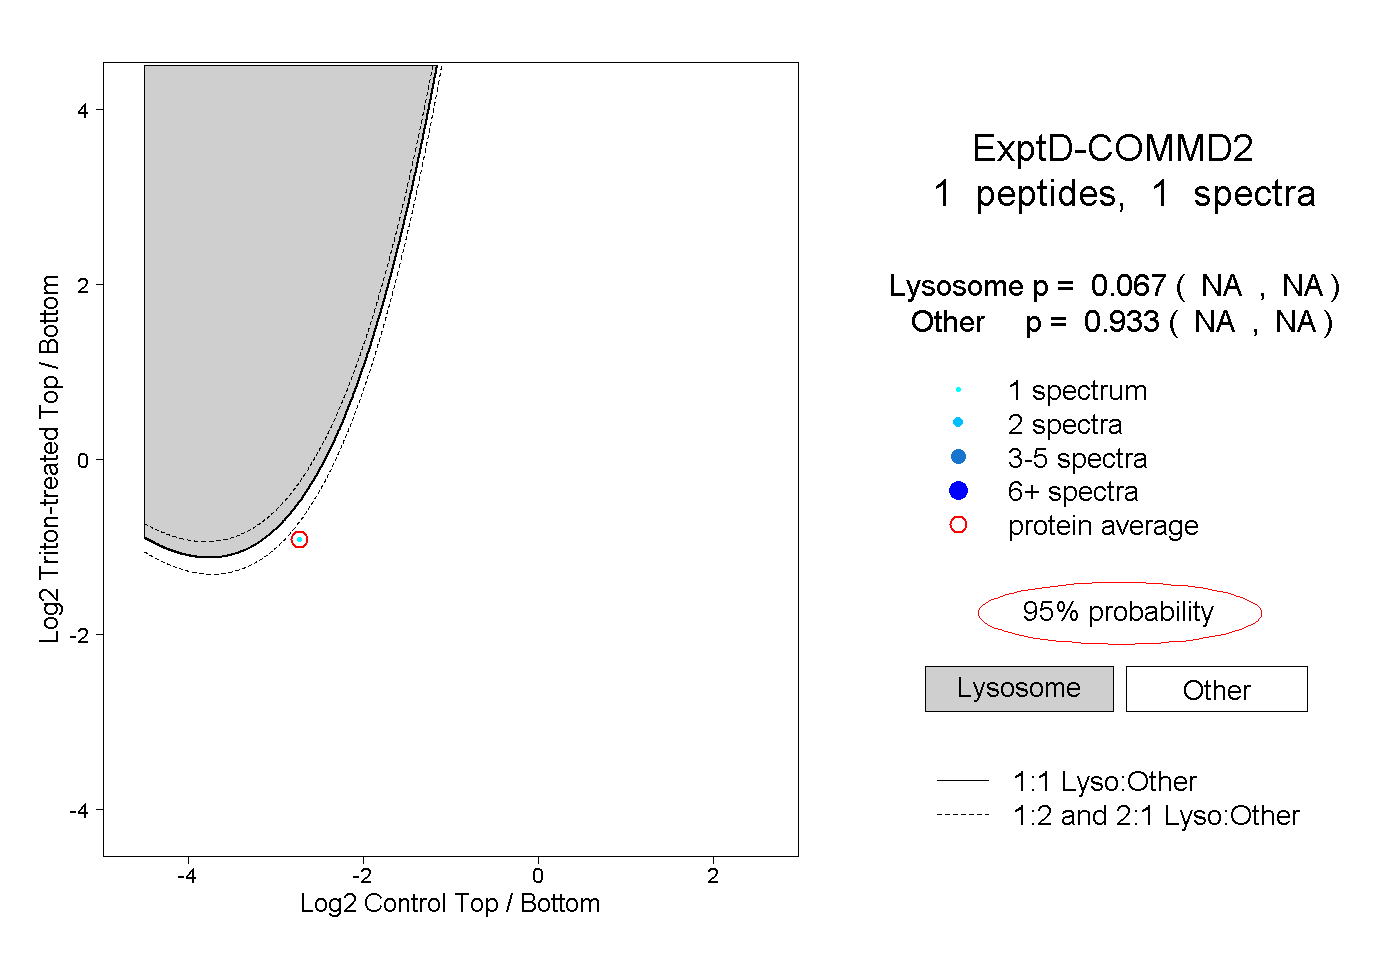
| Expt D |
1
peptide |
1
spectrum |
 |
|
0.067
NA | NA |
|
|
|
|
|
|
|
0.933
NA | NA |