 40
40peptides
spectra
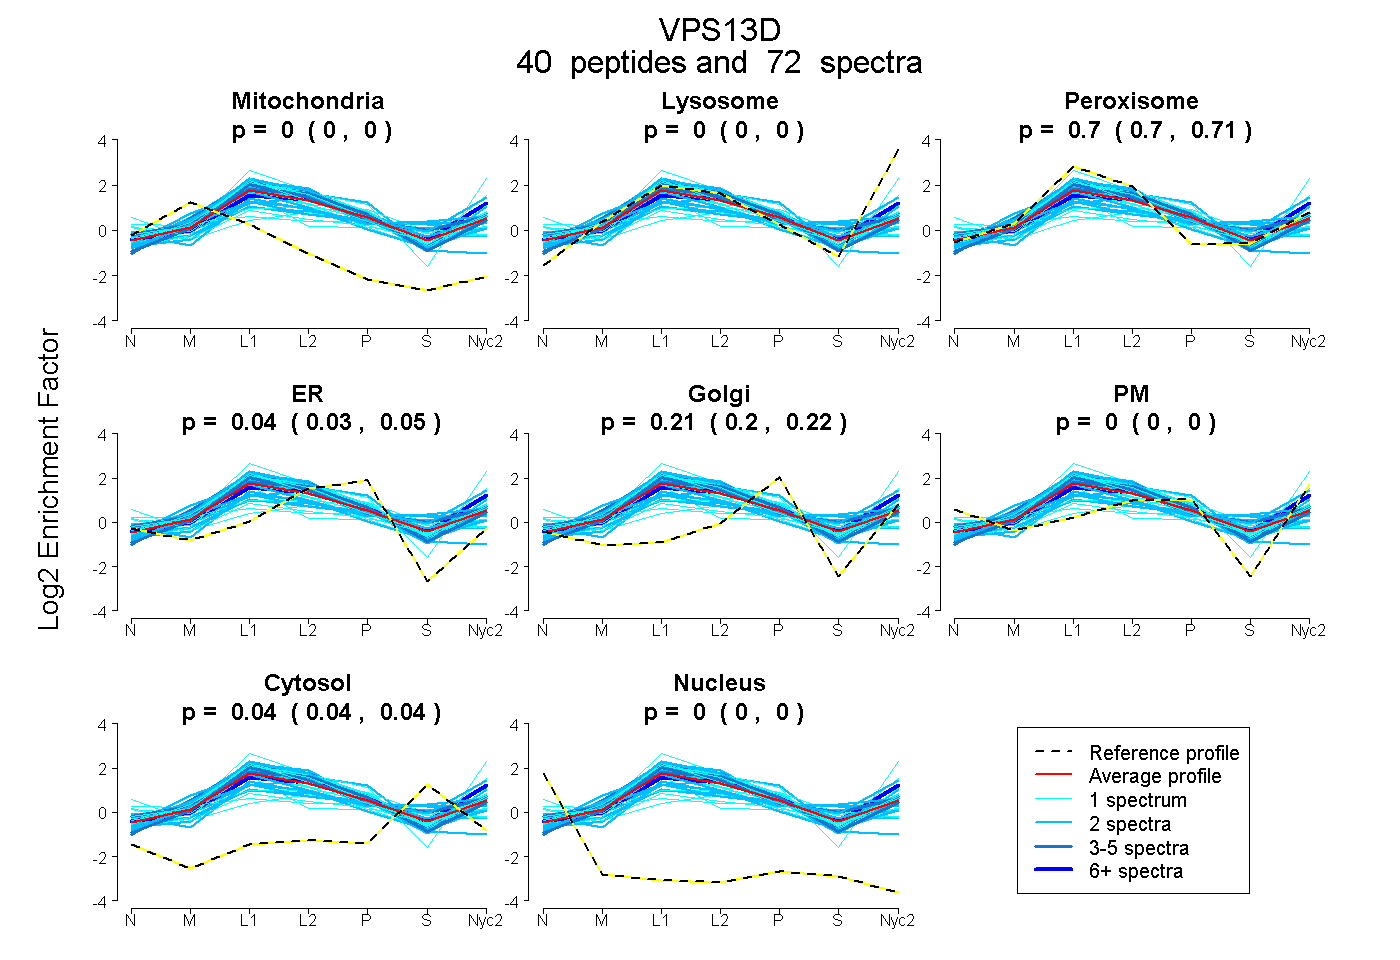
0.000 | 0.000
0.000 | 0.000
0.699 | 0.707
0.031 | 0.052
0.202 | 0.222
0.000 | 0.000
0.039 | 0.045
0.000 | 0.000
10peptides
spectra
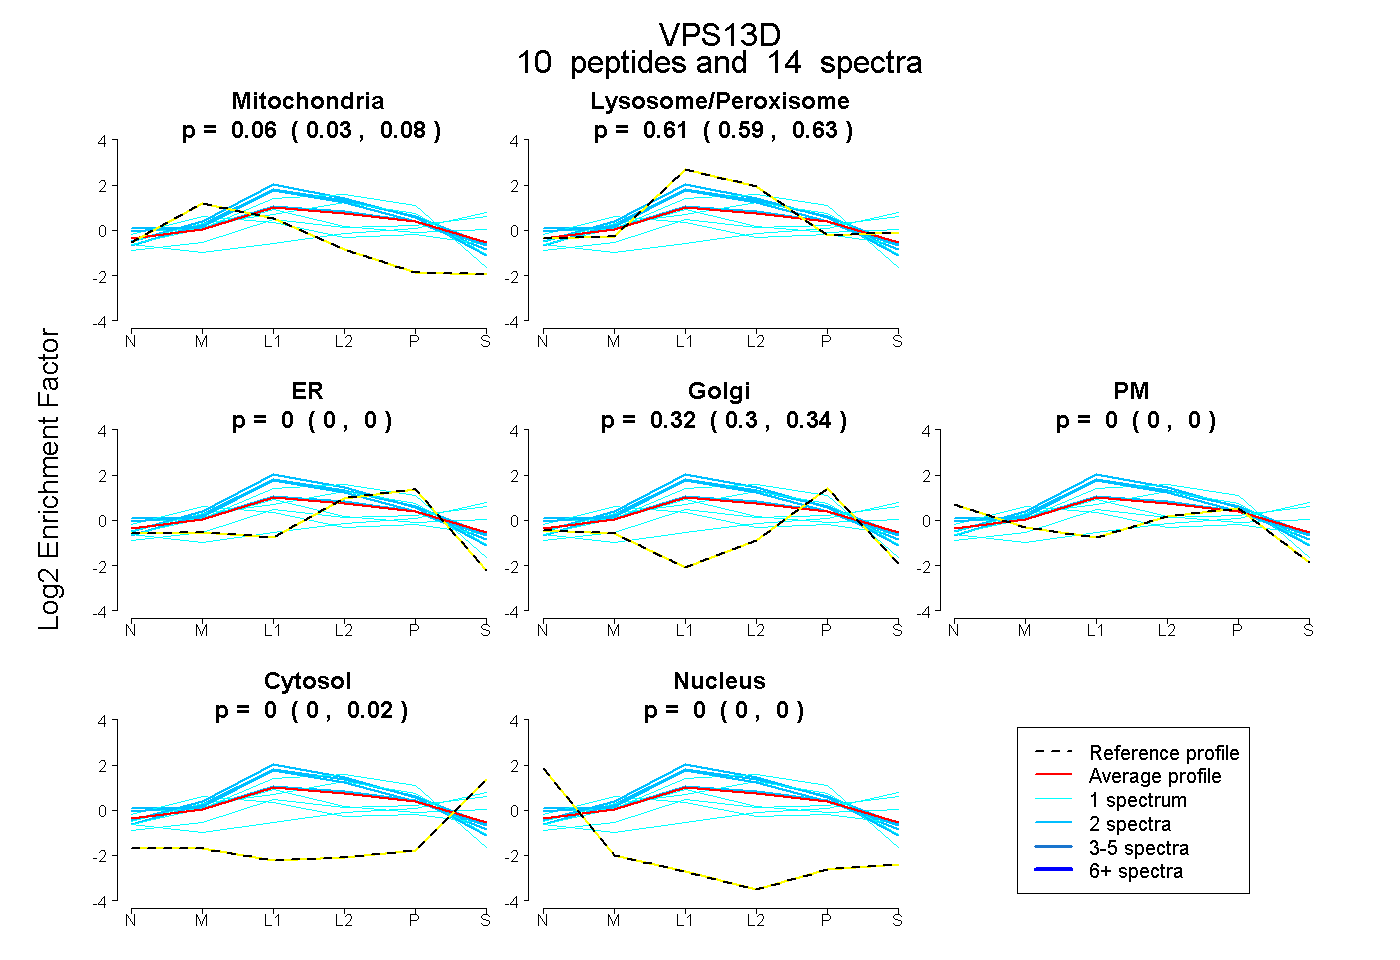
0.028 | 0.080
0.586 | 0.633
0.000 | 0.000
0.300 | 0.343
0.000 | 0.000
0.000 | 0.022
0.000 | 0.000
95peptides
spectra
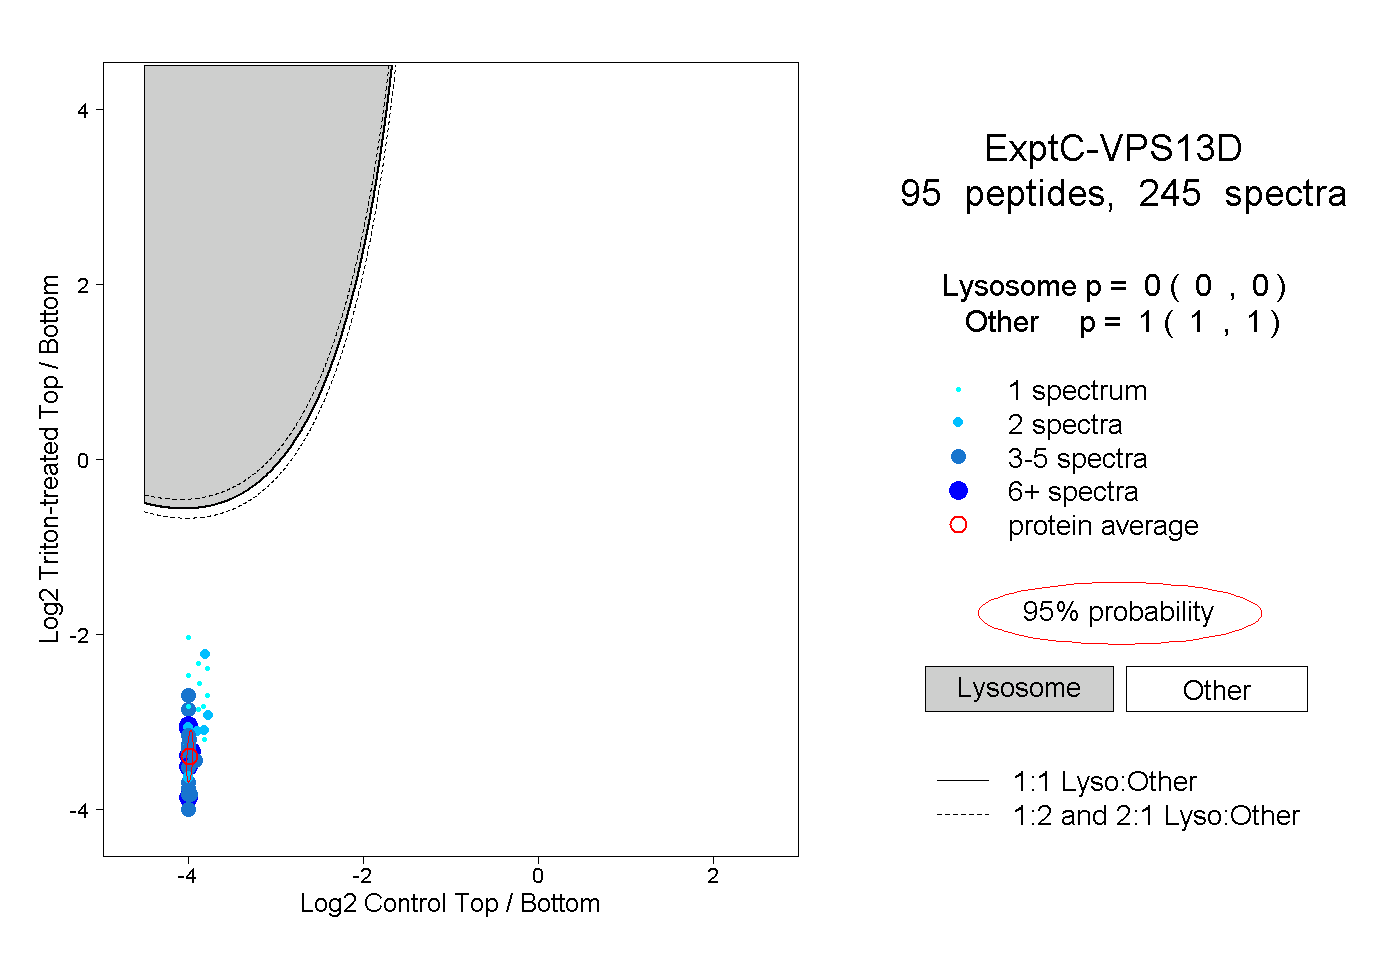
0.000 | 0.000
1.000 | 1.000
17peptides
spectra
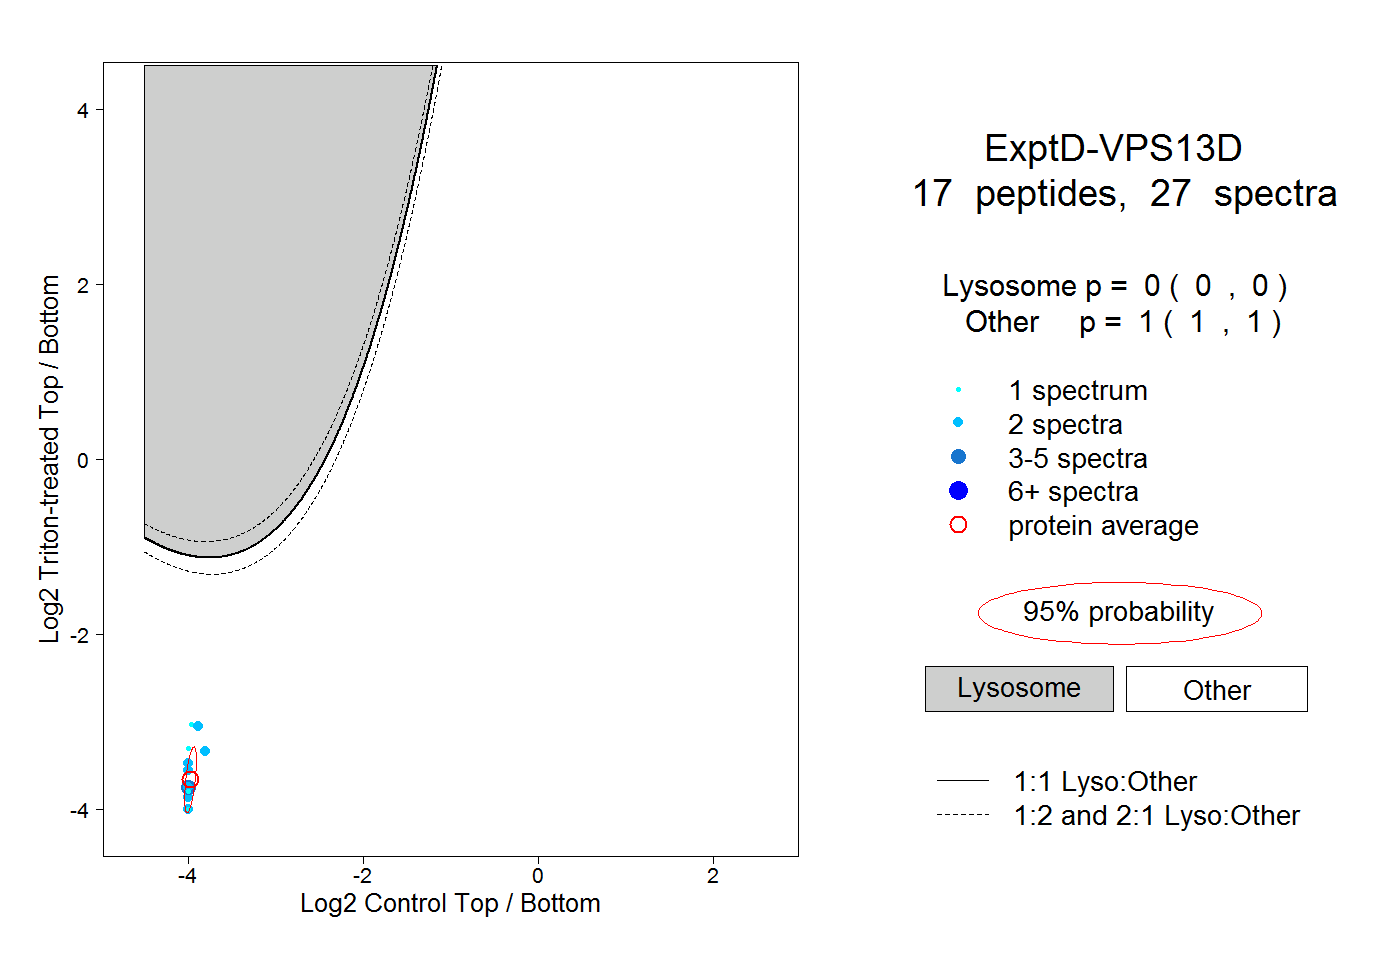
0.000 | 0.000
1.000 | 1.000