 40
40peptides
spectra
0.000 | 0.000
0.000 | 0.000
0.699 | 0.707
0.031 | 0.052
0.202 | 0.222
0.000 | 0.000
0.039 | 0.045
0.000 | 0.000
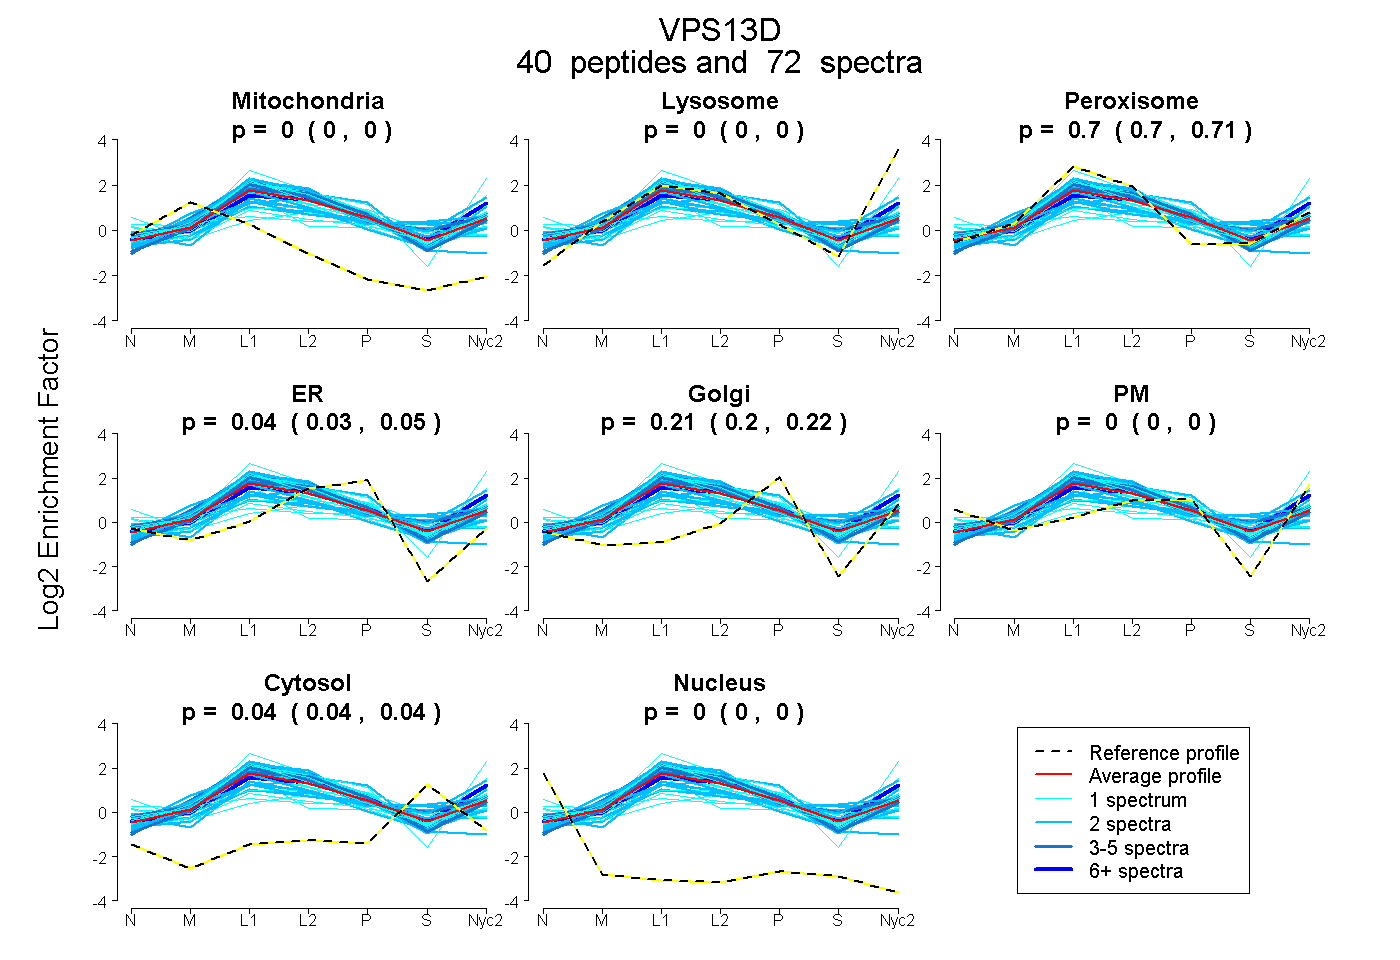
| Plot | Mito | Lyso | Perox | ER | Golgi | PM | Cytosol | Nucleus | |||||
| Expt A |
40 peptides |
72 spectra |
|
0.000 0.000 | 0.000 |
0.000 0.000 | 0.000 |
0.703 0.699 | 0.707 |
0.042 0.031 | 0.052 |
0.213 0.202 | 0.222 |
0.000 0.000 | 0.000 |
0.042 0.039 | 0.045 |
0.000 0.000 | 0.000 |
| 1 spectrum, ELVHDR | 0.000 | 0.000 | 0.634 | 0.171 | 0.055 | 0.000 | 0.140 | 0.000 | ||
| 1 spectrum, CCTWDFLLHR | 0.118 | 0.000 | 0.420 | 0.044 | 0.241 | 0.000 | 0.178 | 0.000 | ||
| 2 spectra, VSLQMASVQYVHTQR | 0.000 | 0.342 | 0.347 | 0.000 | 0.142 | 0.000 | 0.168 | 0.000 | ||
| 1 spectrum, TDAAGQFEEHELAR | 0.000 | 0.153 | 0.573 | 0.210 | 0.000 | 0.064 | 0.000 | 0.000 | ||
| 1 spectrum, YGQPDPLLQR | 0.000 | 0.000 | 0.794 | 0.000 | 0.202 | 0.000 | 0.004 | 0.000 | ||
| 2 spectra, GRPVASHK | 0.000 | 0.000 | 0.602 | 0.047 | 0.105 | 0.000 | 0.247 | 0.000 | ||
| 1 spectrum, VVFAVTMEGSAR | 0.000 | 0.000 | 0.357 | 0.000 | 0.000 | 0.428 | 0.190 | 0.025 | ||
| 1 spectrum, DNQGAMSAPR | 0.000 | 0.000 | 0.710 | 0.104 | 0.186 | 0.000 | 0.000 | 0.000 | ||
| 8 spectra, MRPGSGMLSVR | 0.000 | 0.146 | 0.566 | 0.000 | 0.251 | 0.000 | 0.038 | 0.000 | ||
| 1 spectrum, VSQSFGLQTASEDR | 0.000 | 0.000 | 0.769 | 0.109 | 0.122 | 0.000 | 0.000 | 0.000 | ||
| 1 spectrum, SLSLVSSSR | 0.000 | 0.000 | 0.720 | 0.128 | 0.151 | 0.000 | 0.000 | 0.000 | ||
| 2 spectra, FNVHLQLER | 0.000 | 0.042 | 0.674 | 0.140 | 0.000 | 0.000 | 0.145 | 0.000 | ||
| 2 spectra, ALQITDFCQR | 0.000 | 0.000 | 0.766 | 0.194 | 0.000 | 0.000 | 0.040 | 0.000 | ||
| 2 spectra, AAVEGQTVR | 0.000 | 0.140 | 0.674 | 0.035 | 0.151 | 0.000 | 0.000 | 0.000 | ||
| 1 spectrum, TGLPLIFR | 0.000 | 0.327 | 0.188 | 0.000 | 0.000 | 0.485 | 0.000 | 0.000 | ||
| 2 spectra, NPVHSHFER | 0.000 | 0.000 | 0.542 | 0.070 | 0.124 | 0.000 | 0.264 | 0.000 | ||
| 1 spectrum, ISFSDTDQLPPPFR | 0.020 | 0.000 | 0.582 | 0.000 | 0.000 | 0.339 | 0.058 | 0.000 | ||
| 1 spectrum, SLLMEDLLEK | 0.000 | 0.000 | 0.681 | 0.175 | 0.040 | 0.000 | 0.104 | 0.000 | ||
| 2 spectra, IQDVHLR | 0.000 | 0.060 | 0.726 | 0.169 | 0.038 | 0.000 | 0.008 | 0.000 | ||
| 2 spectra, AASWLFK | 0.043 | 0.000 | 0.471 | 0.260 | 0.033 | 0.000 | 0.193 | 0.000 | ||
| 2 spectra, GLGVFFCK | 0.019 | 0.000 | 0.548 | 0.432 | 0.000 | 0.000 | 0.001 | 0.000 | ||
| 1 spectrum, ECHSMDTEK | 0.000 | 0.115 | 0.556 | 0.032 | 0.016 | 0.281 | 0.000 | 0.000 | ||
| 2 spectra, QPFVPFALR | 0.159 | 0.000 | 0.666 | 0.000 | 0.170 | 0.000 | 0.005 | 0.000 | ||
| 1 spectrum, LNVQLQR | 0.000 | 0.000 | 0.617 | 0.223 | 0.000 | 0.000 | 0.159 | 0.000 | ||
| 4 spectra, VGTFFR | 0.000 | 0.000 | 0.659 | 0.257 | 0.083 | 0.000 | 0.000 | 0.000 | ||
| 1 spectrum, GLLENNLGEPIEDFMRPYDLQDPR | 0.000 | 0.000 | 0.823 | 0.173 | 0.000 | 0.000 | 0.005 | 0.000 | ||
| 2 spectra, TAEQGGTPTR | 0.000 | 0.066 | 0.662 | 0.189 | 0.007 | 0.000 | 0.075 | 0.000 | ||
| 1 spectrum, NPVLVVVDLGR | 0.000 | 0.139 | 0.603 | 0.232 | 0.027 | 0.000 | 0.000 | 0.000 | ||
| 4 spectra, VPIVFTQHGVAEPR | 0.000 | 0.109 | 0.656 | 0.115 | 0.000 | 0.000 | 0.120 | 0.000 | ||
| 2 spectra, LAFAQR | 0.000 | 0.188 | 0.626 | 0.185 | 0.000 | 0.000 | 0.000 | 0.000 | ||
| 4 spectra, LNFLQHIR | 0.000 | 0.150 | 0.625 | 0.225 | 0.000 | 0.000 | 0.000 | 0.000 | ||
| 1 spectrum, LEGGIGVSLINK | 0.000 | 0.104 | 0.612 | 0.195 | 0.088 | 0.000 | 0.000 | 0.000 | ||
| 2 spectra, VADFFYK | 0.000 | 0.017 | 0.713 | 0.238 | 0.000 | 0.032 | 0.000 | 0.000 | ||
| 1 spectrum, SGDYIDR | 0.000 | 0.041 | 0.694 | 0.000 | 0.265 | 0.000 | 0.000 | 0.000 | ||
| 2 spectra, IHQLQVR | 0.000 | 0.000 | 0.524 | 0.364 | 0.029 | 0.000 | 0.083 | 0.000 | ||
| 1 spectrum, QEELAESLR | 0.000 | 0.000 | 0.510 | 0.186 | 0.173 | 0.000 | 0.130 | 0.000 | ||
| 1 spectrum, EVLVESQLLLAEFK | 0.118 | 0.000 | 0.589 | 0.000 | 0.116 | 0.000 | 0.177 | 0.000 | ||
| 2 spectra, VLLQALEER | 0.000 | 0.086 | 0.551 | 0.000 | 0.117 | 0.000 | 0.246 | 0.000 | ||
| 1 spectrum, ESWLADYCK | 0.000 | 0.058 | 0.268 | 0.000 | 0.000 | 0.419 | 0.255 | 0.000 | ||
| 2 spectra, LSVFTSNK | 0.014 | 0.000 | 0.675 | 0.127 | 0.184 | 0.000 | 0.000 | 0.000 |
| Plot | Mito | Lyso or Perox | ER | Golgi | PM | Cytosol | Nucleus | ||||||
| Expt B |
10 peptides |
14 spectra |
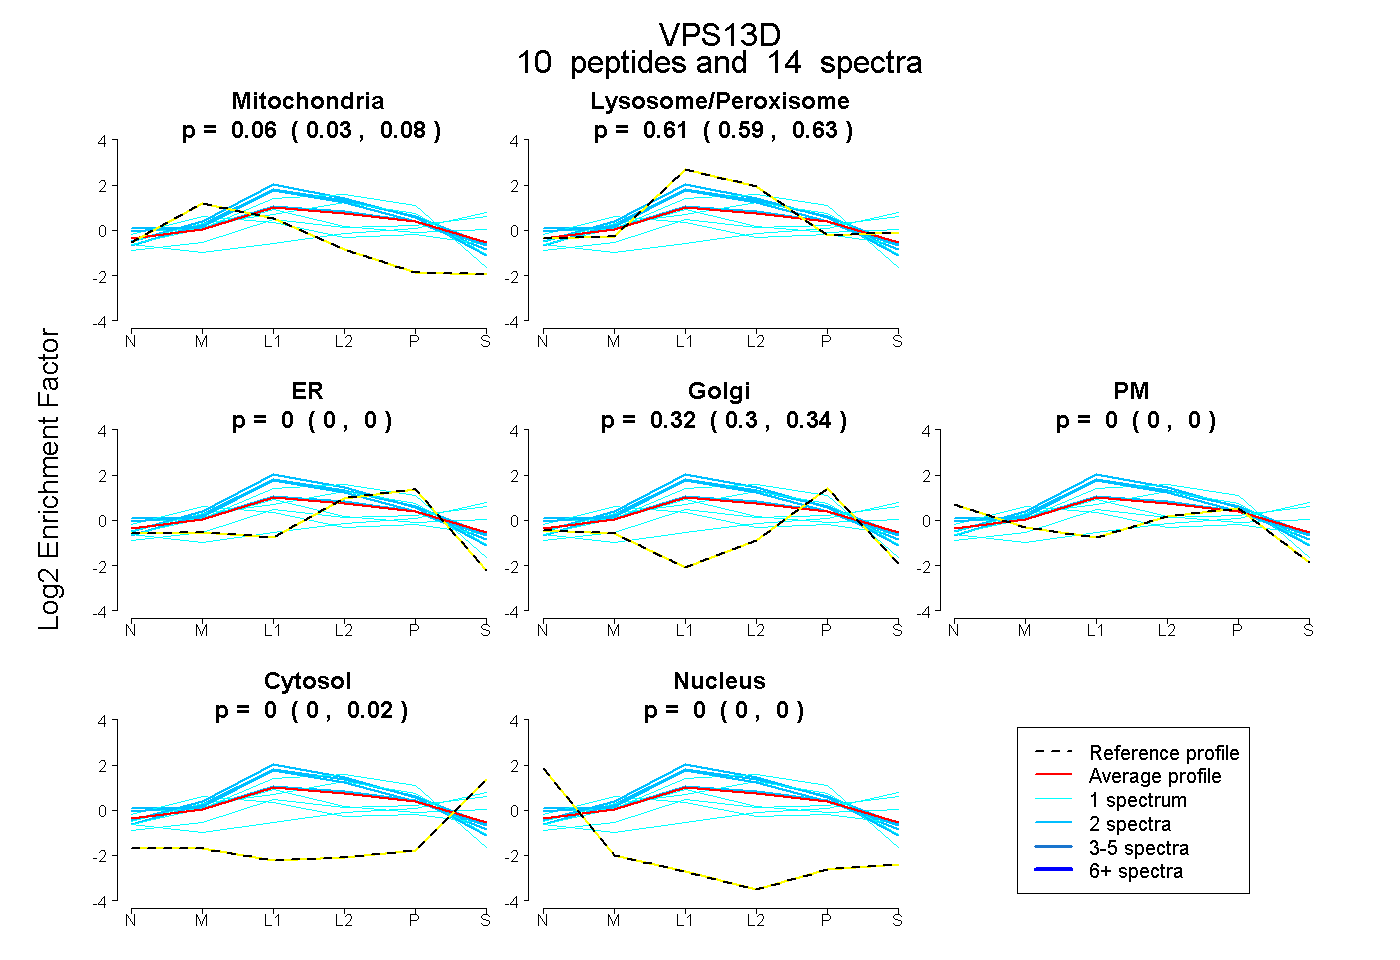 |
0.059 0.028 | 0.080 |
0.613 0.586 | 0.633 |
0.000 0.000 | 0.000 |
0.324 0.300 | 0.343 |
0.000 0.000 | 0.000 |
0.004 0.000 | 0.022 |
0.000 0.000 | 0.000 |
|||
| Plot | Lyso | Other | |||||||||||
| Expt C |
95 peptides |
245 spectra |
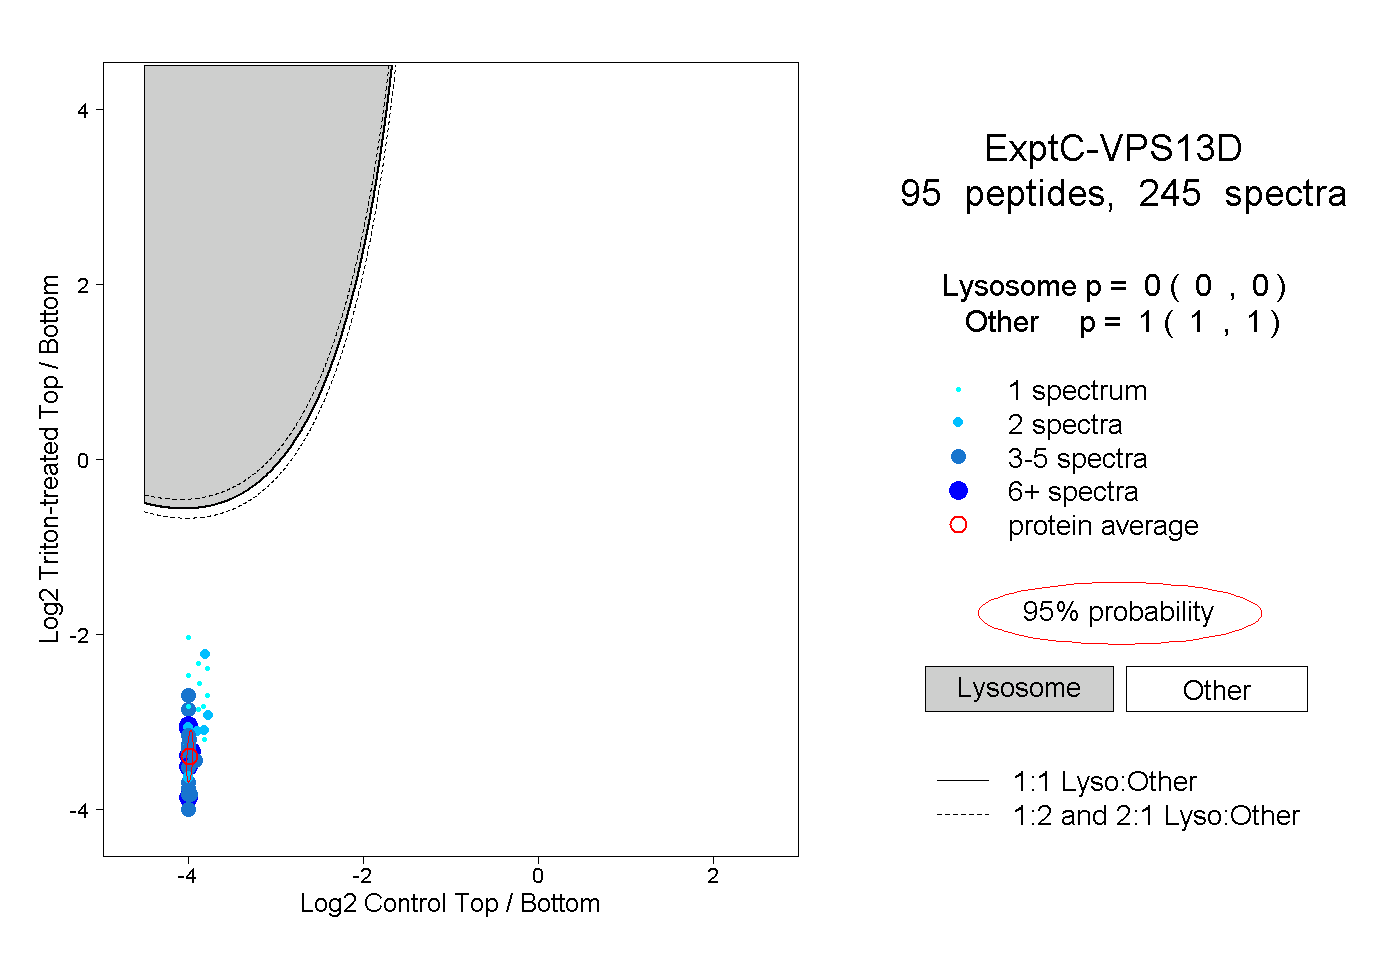 |
0.000 0.000 | 0.000 |
1.000 1.000 | 1.000 |
||||||||
| Plot | Lyso | Other | |||||||||||
| Expt D |
17 peptides |
27 spectra |
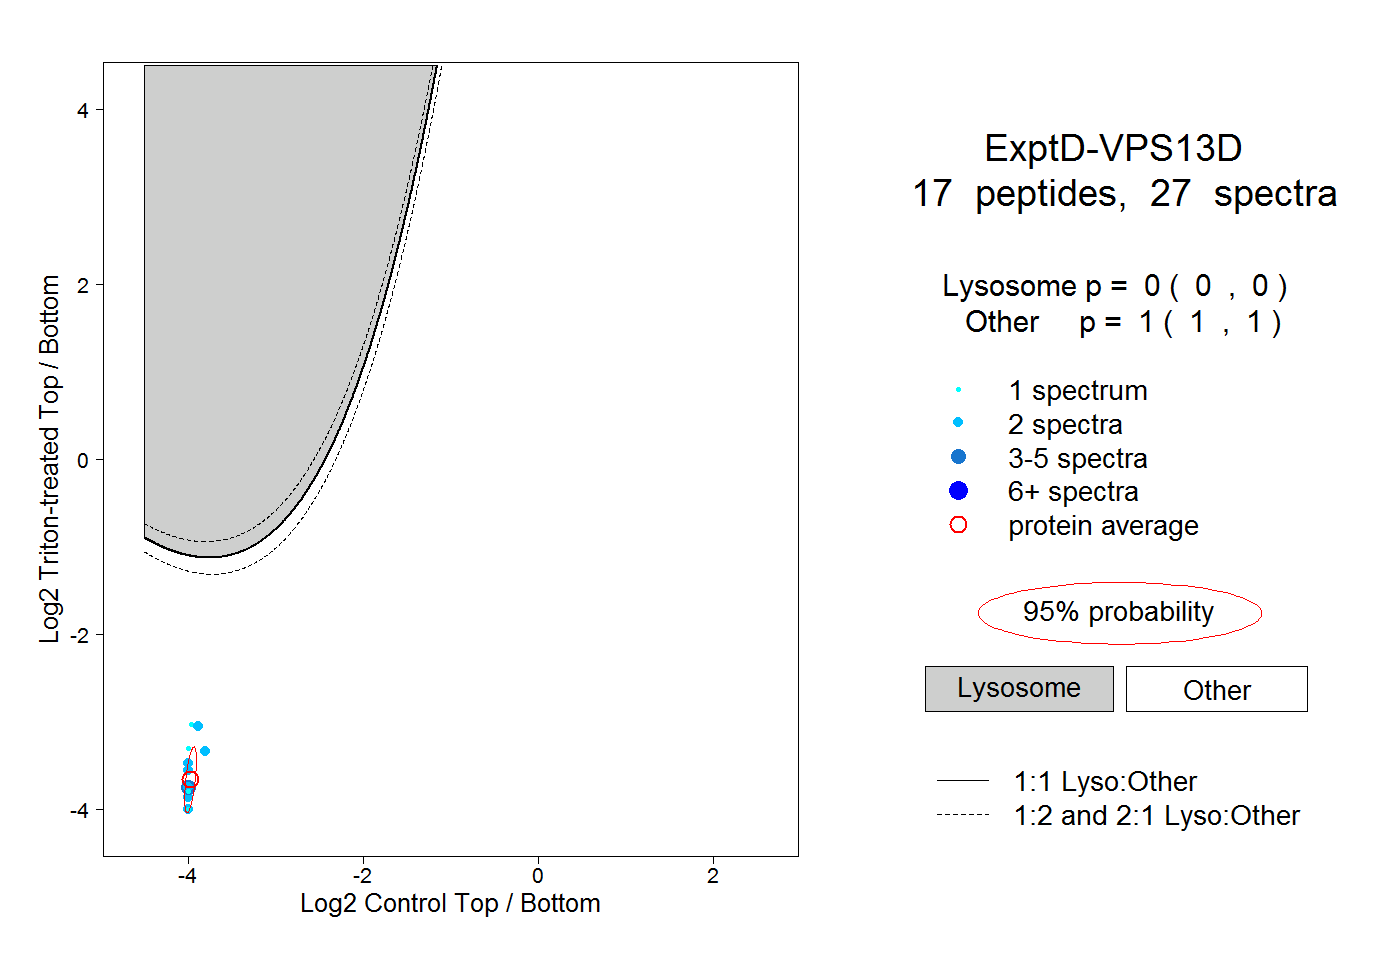 |
0.000 0.000 | 0.000 |
1.000 1.000 | 1.000 |