VPS13D
[ENSRNOP00000022185]
Main page
| | | Plot |
Mito |
Lyso |
|
Perox |
ER |
Golgi |
PM |
Cytosol |
Nucleus |
|
| Expt A |
 40
40
peptides |
72
spectra |
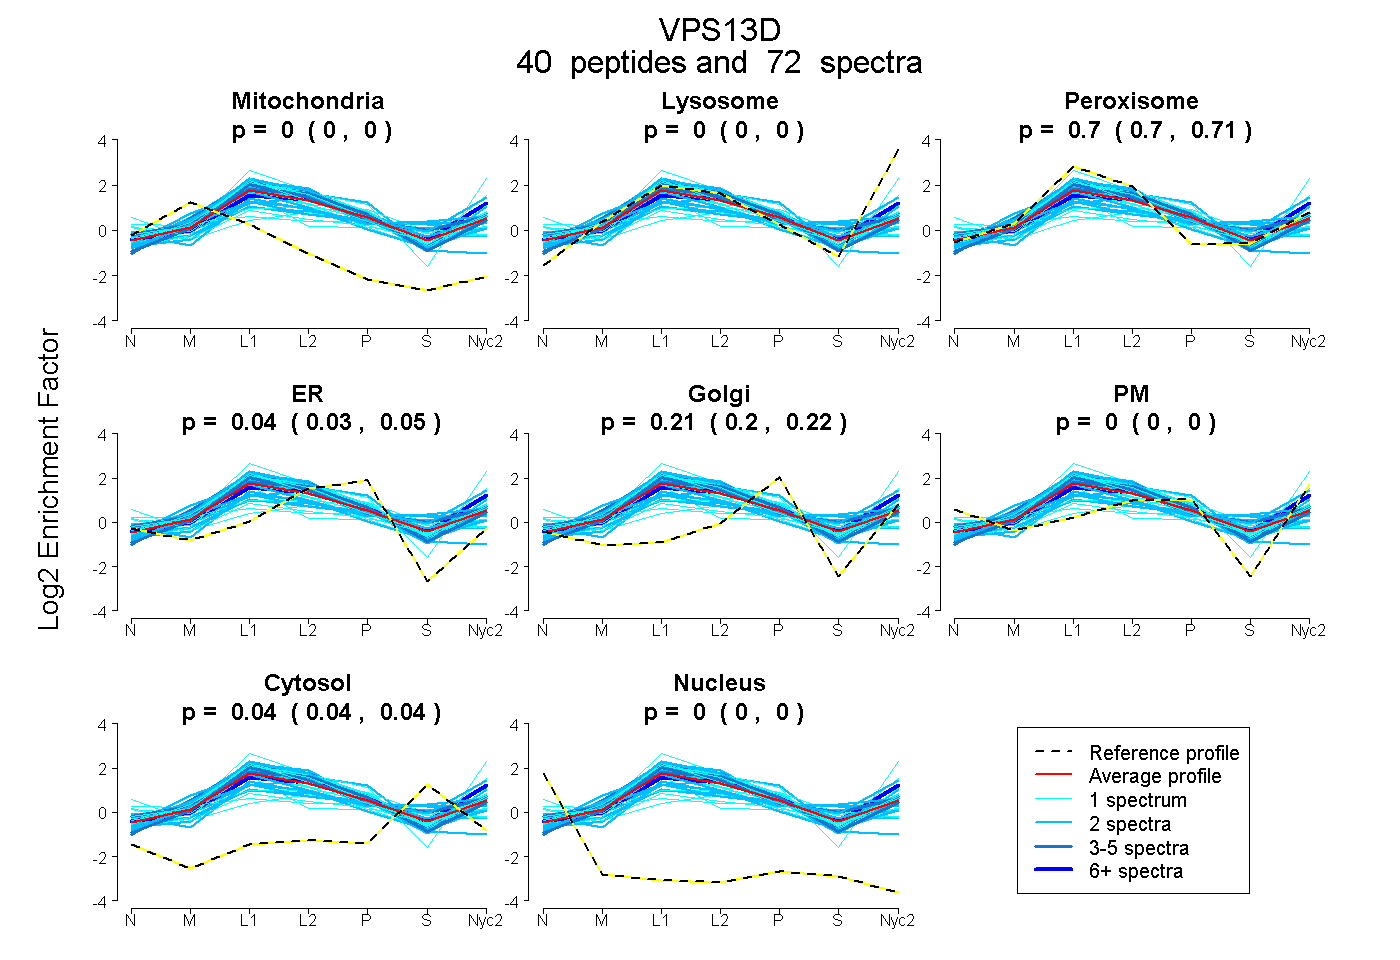 |
0.000
0.000 | 0.000 |
0.000
0.000 | 0.000 |
|
0.703
0.699 | 0.707 |
0.042
0.031 | 0.052 |
0.213
0.202 | 0.222 |
0.000
0.000 | 0.000 |
0.042
0.039 | 0.045 |
0.000
0.000 | 0.000 |
|
| | | Plot |
Mito |
|
Lyso or Perox |
|
ER |
Golgi |
PM |
Cytosol |
Nucleus |
|
| Expt B |
10
peptides |
14
spectra |
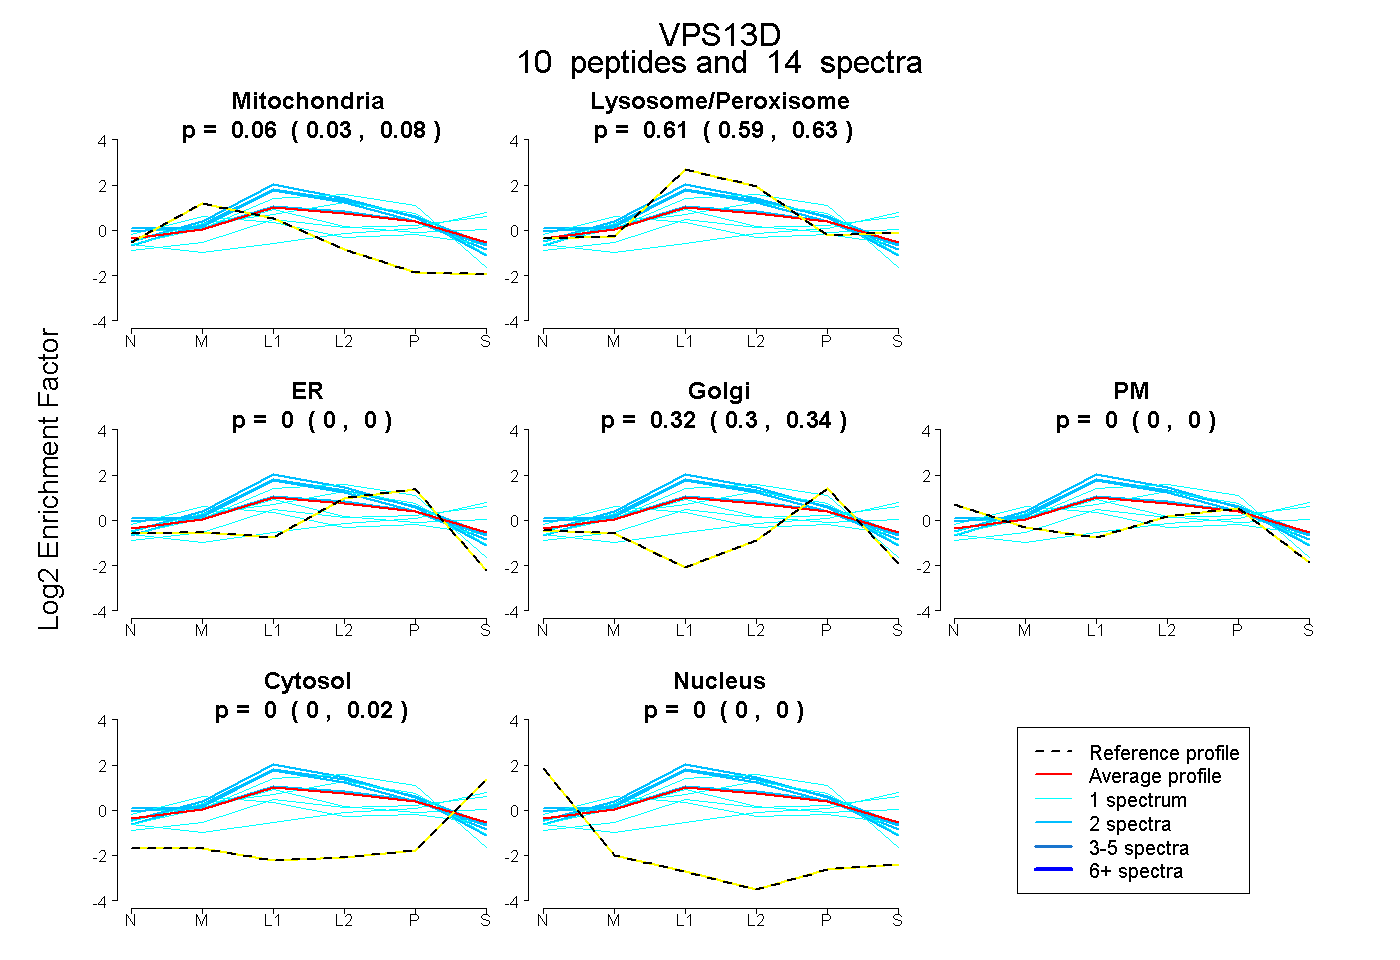 |
0.059
0.028 | 0.080 |
|
0.613
0.586 | 0.633 |
|
0.000
0.000 | 0.000 |
0.324
0.300 | 0.343 |
0.000
0.000 | 0.000 |
0.004
0.000 | 0.022 |
0.000
0.000 | 0.000 |
|
| 1 spectrum, VGTFFR |
0.000 |
|
0.532 |
|
0.000 |
0.167 |
0.000 |
0.302 |
0.000 |
|
| 2 spectra, TGLPLIFR |
0.028 |
|
0.687 |
|
0.043 |
0.040 |
0.203 |
0.000 |
0.000 |
|
| 1 spectrum, STLGFPLIR |
0.000 |
|
0.494 |
|
0.506 |
0.000 |
0.000 |
0.000 |
0.000 |
|
| 2 spectra, FVNPVQVVLAK |
0.038 |
|
0.530 |
|
0.000 |
0.122 |
0.310 |
0.000 |
0.000 |
|
| 2 spectra, IQDVHLR |
0.034 |
|
0.700 |
|
0.203 |
0.063 |
0.000 |
0.000 |
0.000 |
|
| 1 spectrum, HFQEELLSQAAR |
0.086 |
|
0.490 |
|
0.000 |
0.000 |
0.249 |
0.175 |
0.000 |
|
| 1 spectrum, IFISAPYWLINK |
0.334 |
|
0.300 |
|
0.000 |
0.214 |
0.072 |
0.081 |
0.000 |
|
| 2 spectra, LAFAQR |
0.074 |
|
0.663 |
|
0.263 |
0.000 |
0.000 |
0.000 |
0.000 |
|
| 1 spectrum, SLSLVSSSR |
0.074 |
|
0.425 |
|
0.466 |
0.036 |
0.000 |
0.000 |
0.000 |
|
| 1 spectrum, IVENIELK |
0.000 |
|
0.370 |
|
0.000 |
0.223 |
0.000 |
0.407 |
0.000 |
|
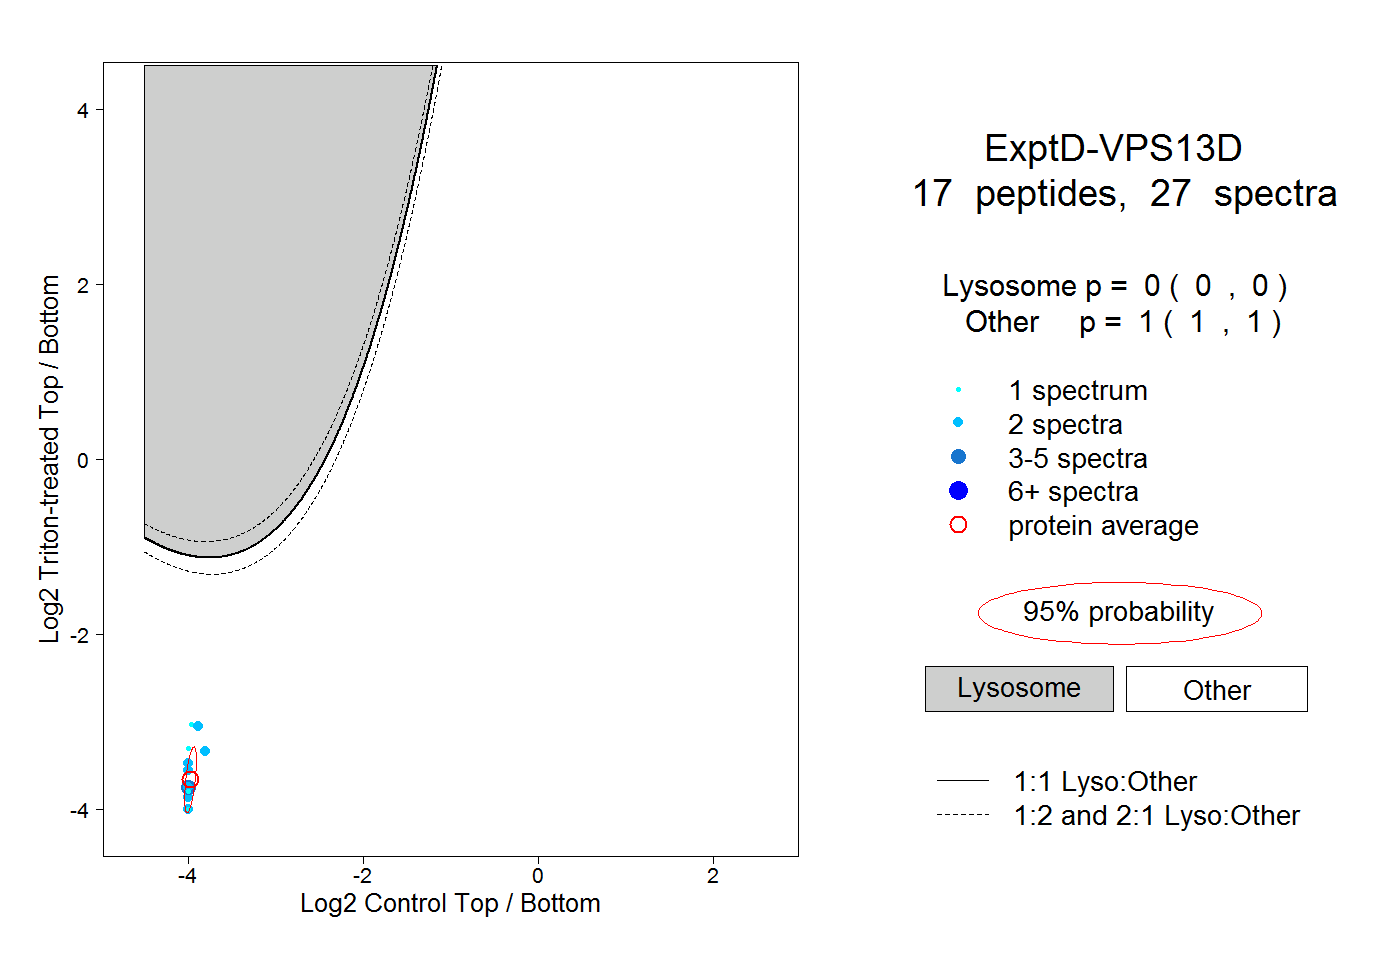
| | | Plot |
|
Lyso |
|
|
|
|
|
|
|
Other |
| Expt C |
95
peptides |
245
spectra |
 |
|
0.000
0.000 | 0.000 |
|
|
|
|
|
|
|
1.000
1.000 | 1.000 |
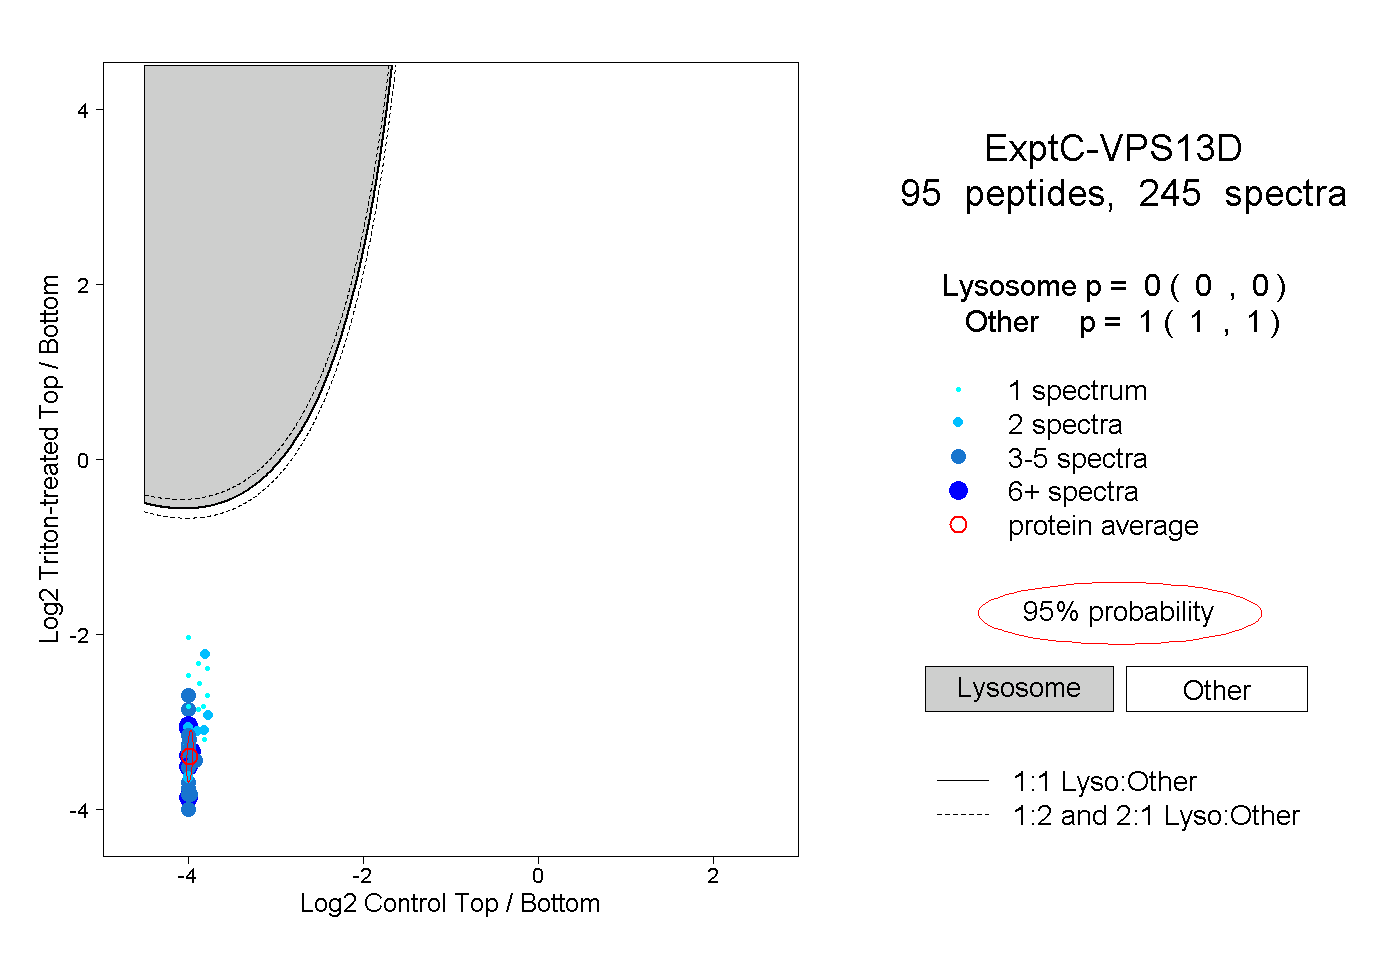
| | | Plot |
|
Lyso |
|
|
|
|
|
|
|
Other |
| Expt D |
17
peptides |
27
spectra |
 |
|
0.000
0.000 | 0.000 |
|
|
|
|
|
|
|
1.000
1.000 | 1.000 |