 6
6peptides
spectra
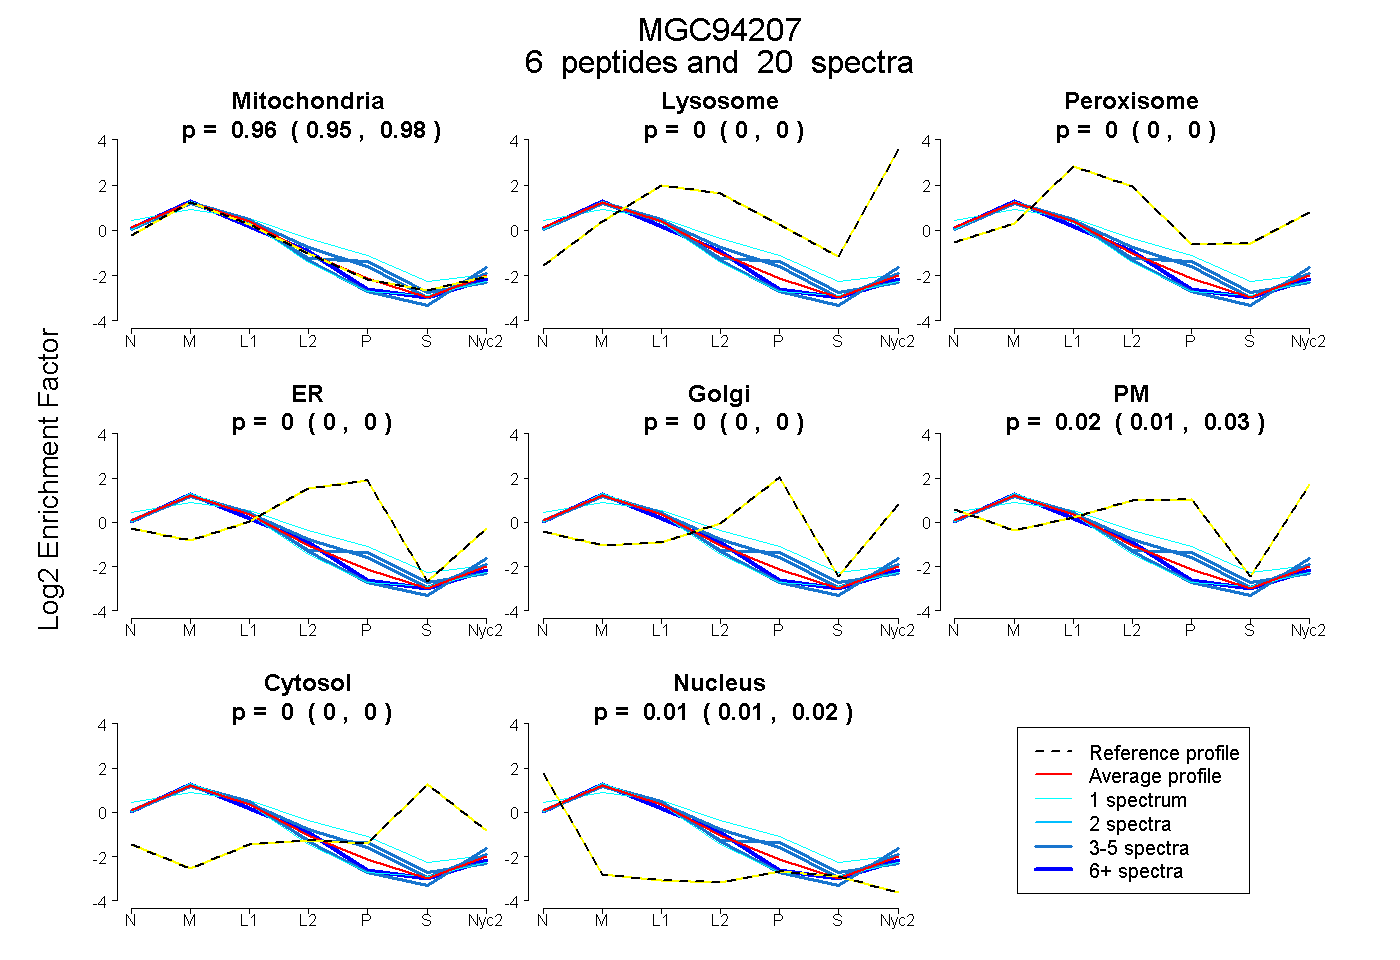
0.950 | 0.976
0.000 | 0.000
0.000 | 0.000
0.000 | 0.000
0.000 | 0.000
0.006 | 0.034
0.000 | 0.000
0.010 | 0.019
6peptides
spectra
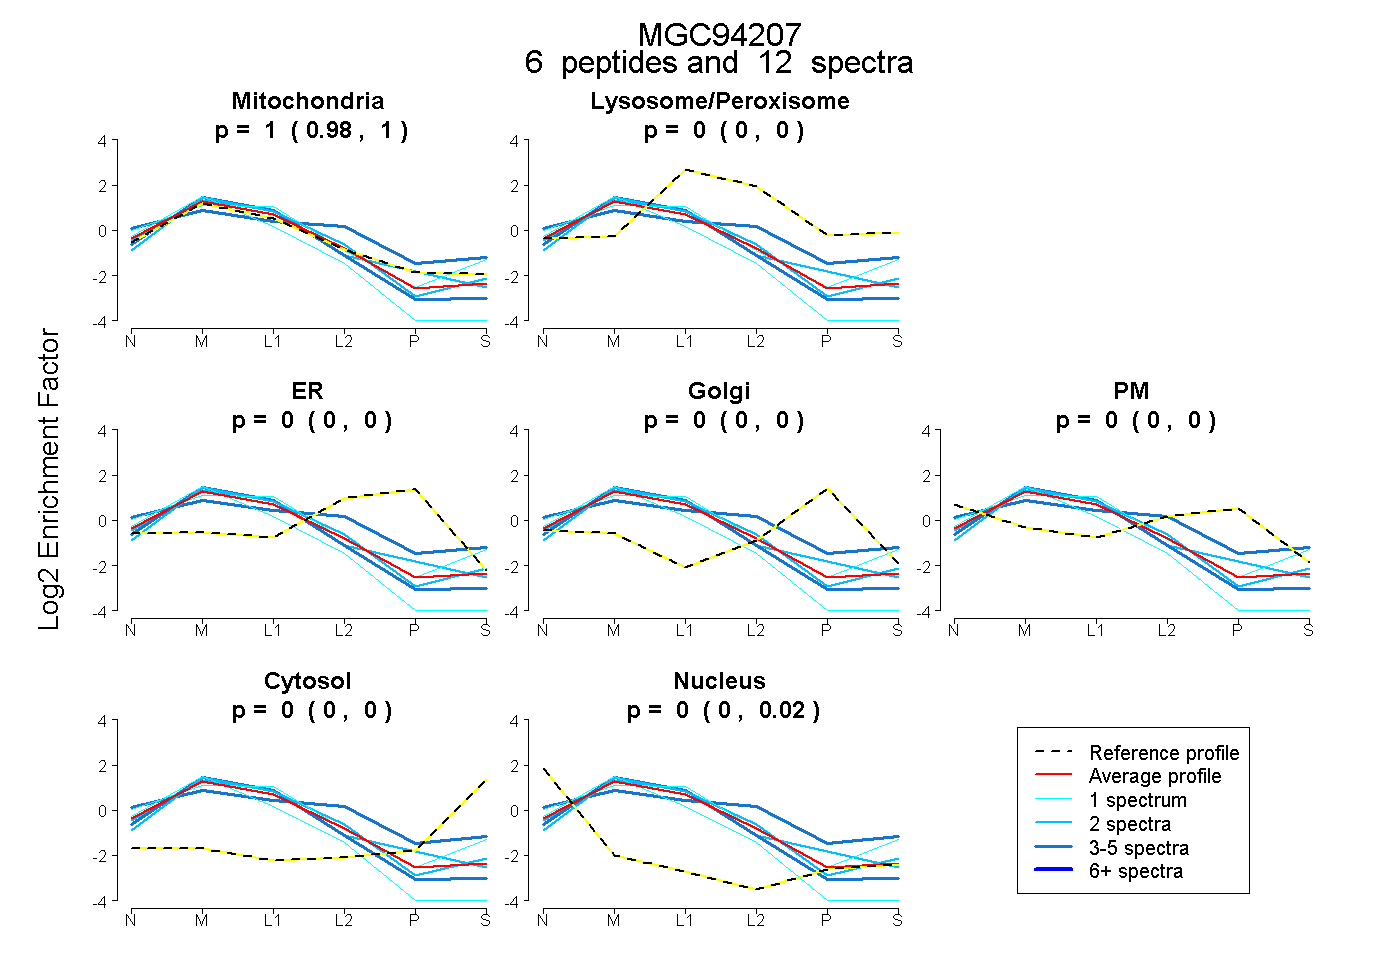
0.980 | 1.000
0.000 | 0.000
0.000 | 0.000
0.000 | 0.000
0.000 | 0.000
0.000 | 0.000
0.000 | 0.018
7peptides
spectra
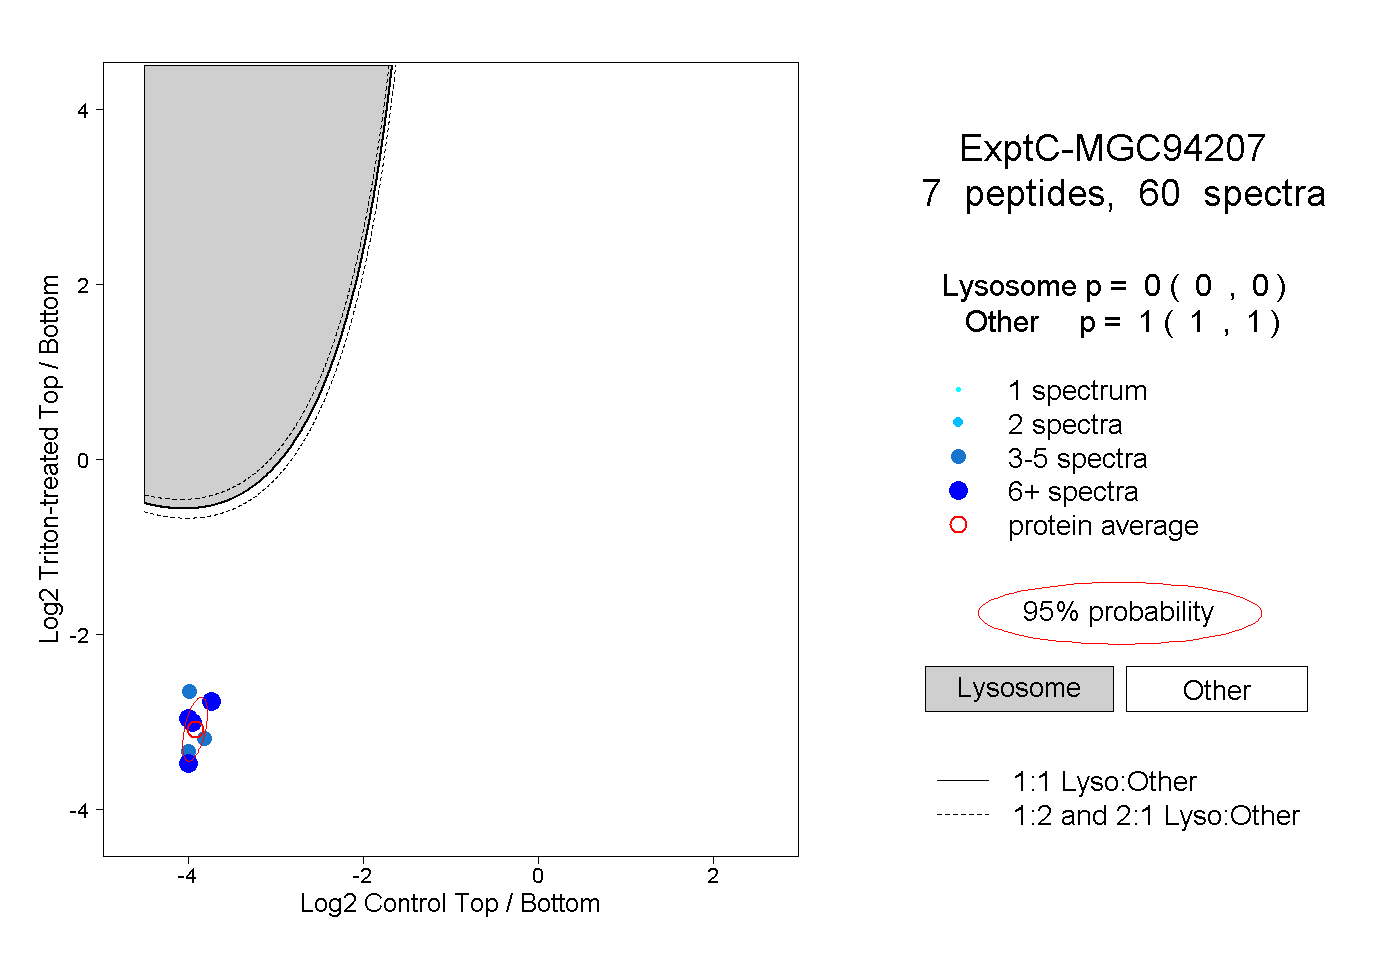
0.000 | 0.000
1.000 | 1.000
1peptide
spectrum
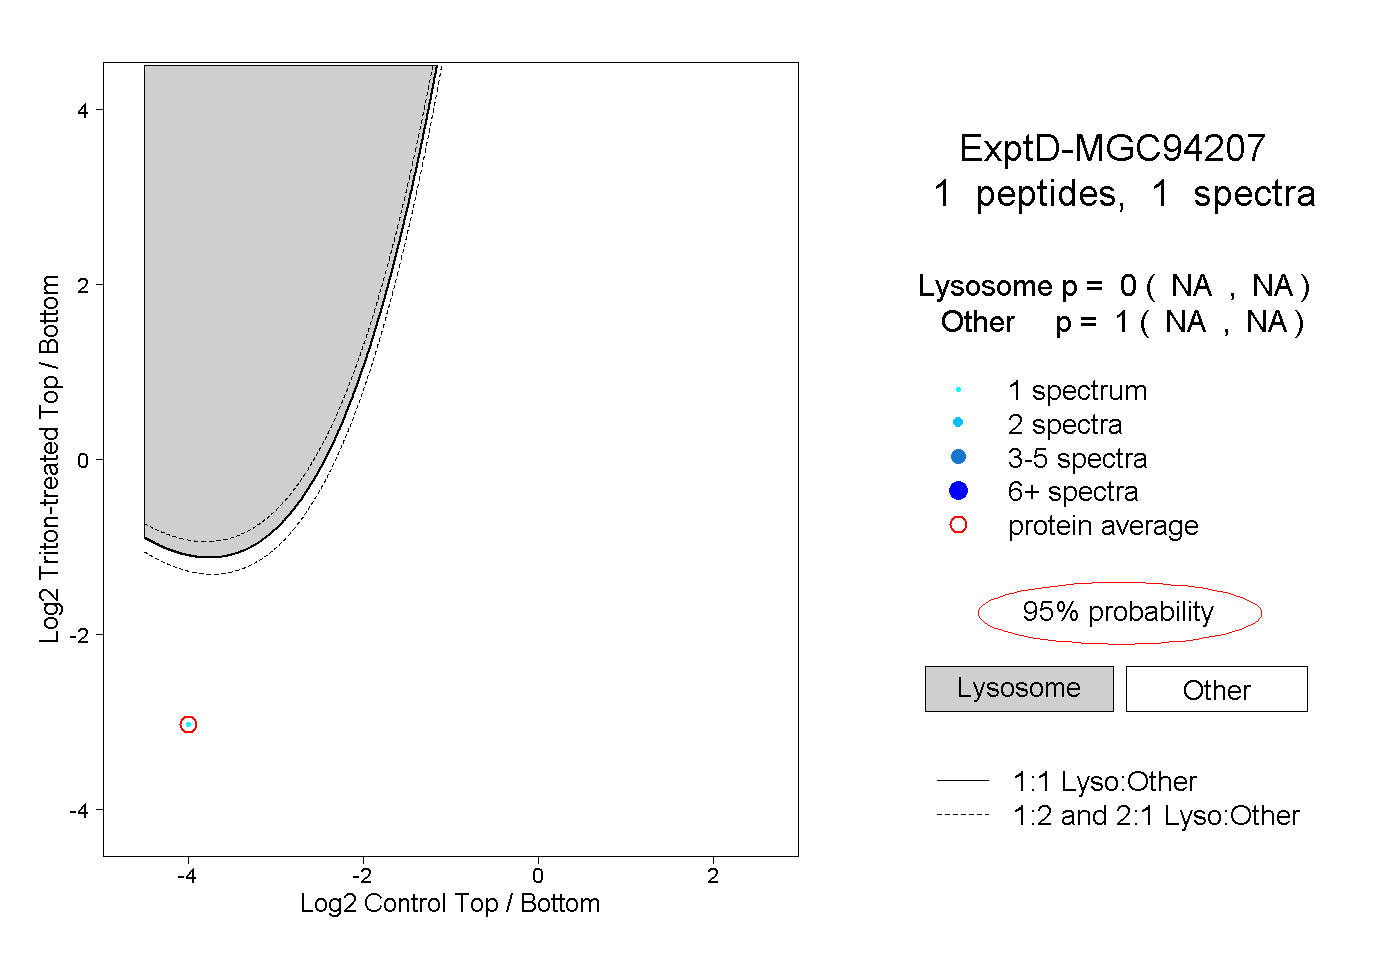
NA | NA
NA | NA