MGC94207
[ENSRNOP00000021775]
Main page
| | | Plot |
Mito |
Lyso |
|
Perox |
ER |
Golgi |
PM |
Cytosol |
Nucleus |
|
| Expt A |
 6
6
peptides |
20
spectra |
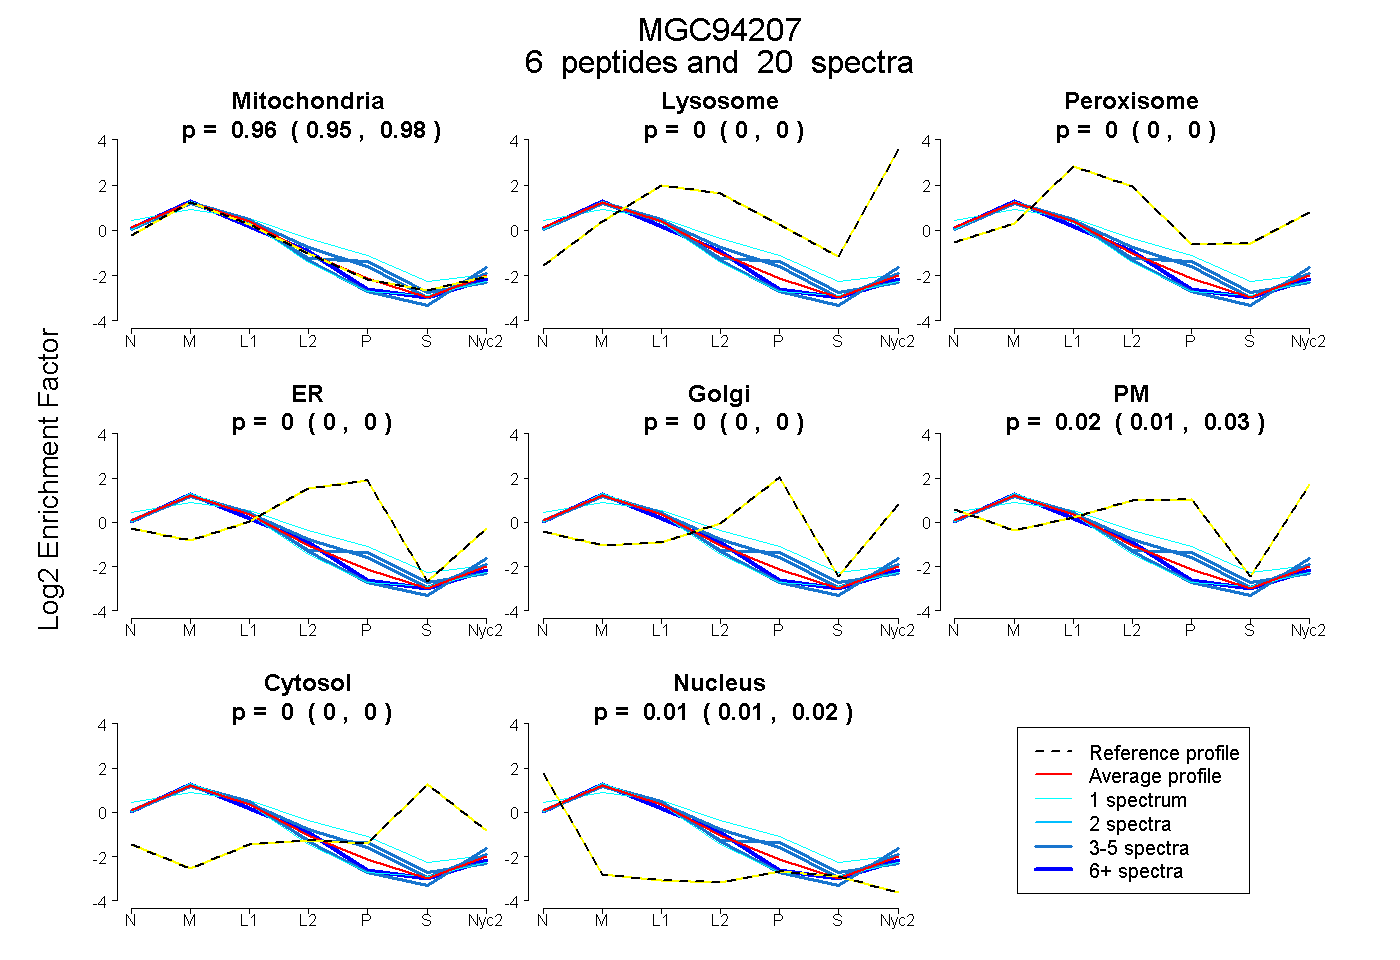 |
0.965
0.950 | 0.976 |
0.000
0.000 | 0.000 |
|
0.000
0.000 | 0.000 |
0.000
0.000 | 0.000 |
0.000
0.000 | 0.000 |
0.021
0.006 | 0.034 |
0.000
0.000 | 0.000 |
0.015
0.010 | 0.019 |
|
| | | Plot |
Mito |
|
Lyso or Perox |
|
ER |
Golgi |
PM |
Cytosol |
Nucleus |
|
| Expt B |
6
peptides |
12
spectra |
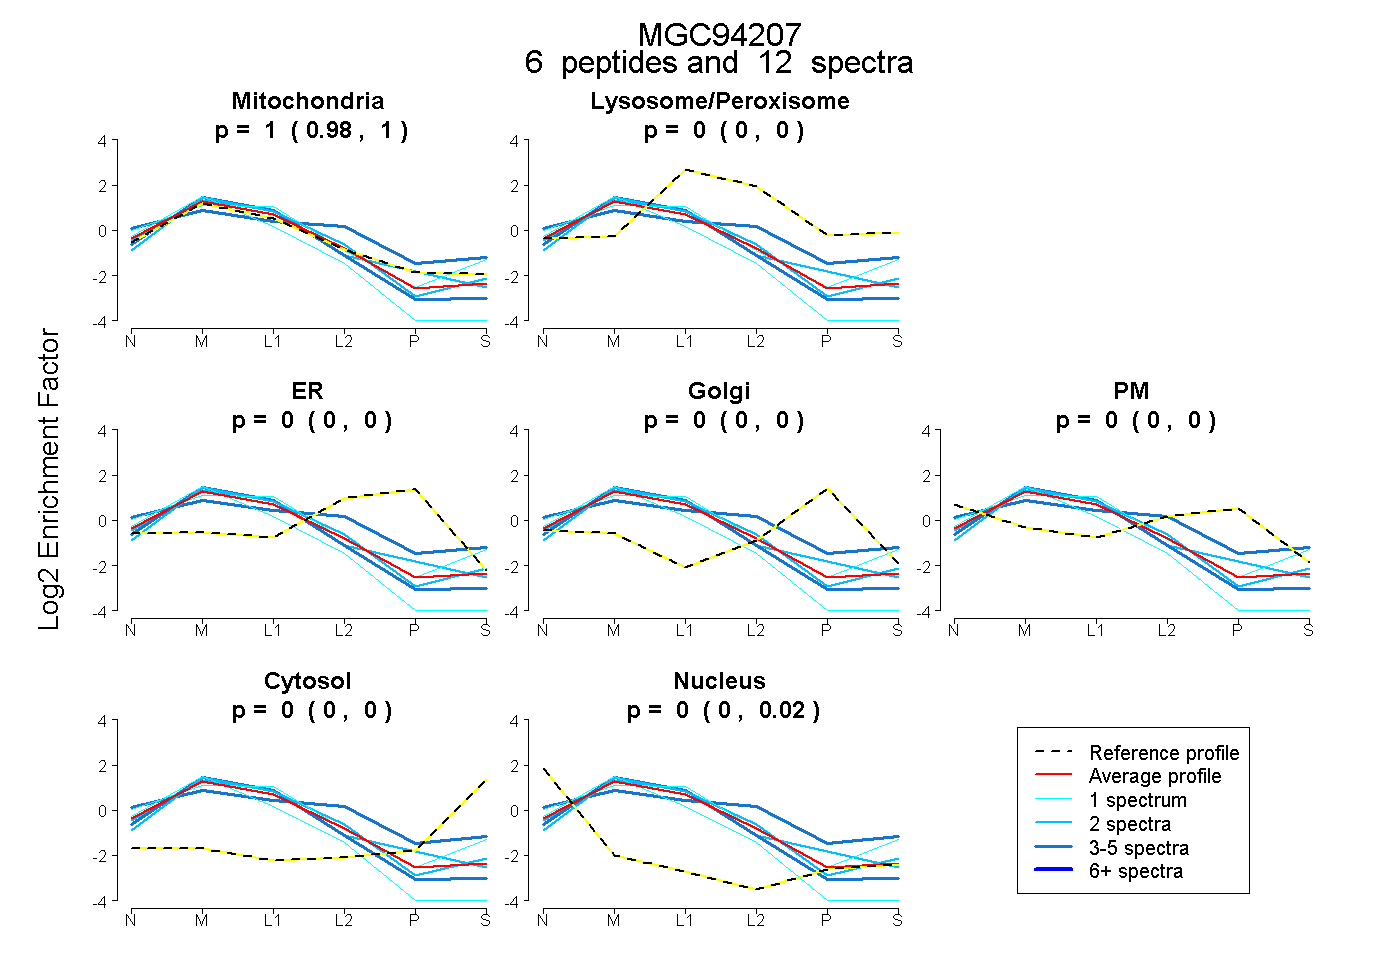 |
0.996
0.980 | 1.000 |
|
0.000
0.000 | 0.000 |
|
0.000
0.000 | 0.000 |
0.000
0.000 | 0.000 |
0.000
0.000 | 0.000 |
0.000
0.000 | 0.000 |
0.004
0.000 | 0.018 |
|
| 2 spectra, AGGVGLVR |
1.000 |
|
0.000 |
|
0.000 |
0.000 |
0.000 |
0.000 |
0.000 |
|
| 1 spectrum, NFITCFK |
0.888 |
|
0.081 |
|
0.000 |
0.000 |
0.000 |
0.000 |
0.032 |
|
| 1 spectrum, VSYTQGQSPEPR |
0.857 |
|
0.000 |
|
0.000 |
0.000 |
0.000 |
0.000 |
0.143 |
|
| 2 spectra, LYHPAPER |
1.000 |
|
0.000 |
|
0.000 |
0.000 |
0.000 |
0.000 |
0.000 |
|
| 3 spectra, LRPNHSGR |
0.604 |
|
0.213 |
|
0.000 |
0.000 |
0.148 |
0.016 |
0.018 |
|
| 3 spectra, LLPLAANGR |
1.000 |
|
0.000 |
|
0.000 |
0.000 |
0.000 |
0.000 |
0.000 |
|
| | | Plot |
|
Lyso |
|
|
|
|
|
|
|
Other |
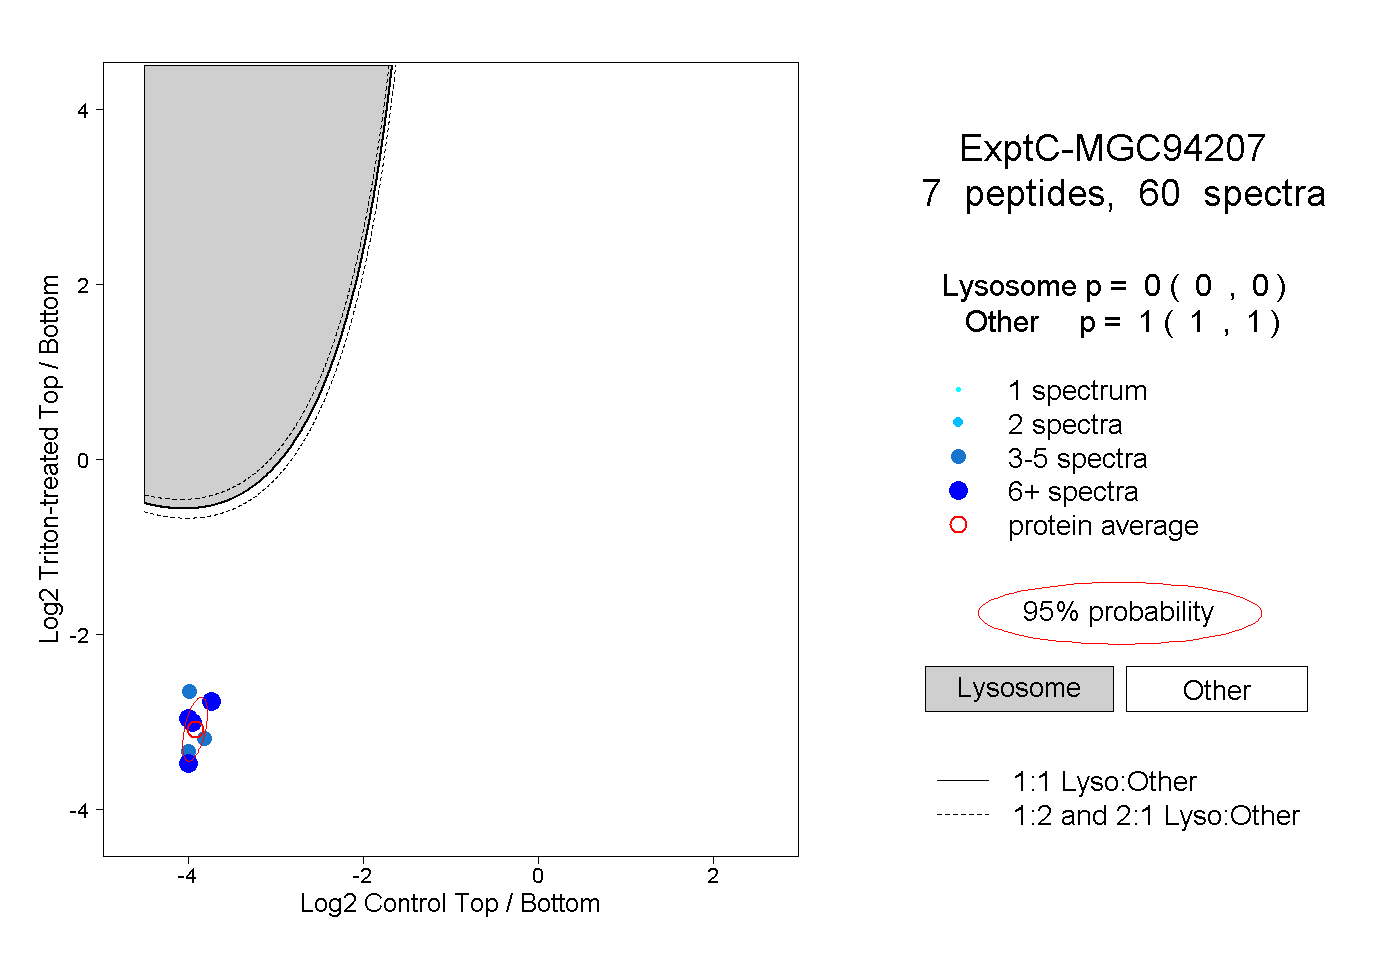
| Expt C |
7
peptides |
60
spectra |
 |
|
0.000
0.000 | 0.000 |
|
|
|
|
|
|
|
1.000
1.000 | 1.000 |
| | | Plot |
|
Lyso |
|
|
|
|
|
|
|
Other |
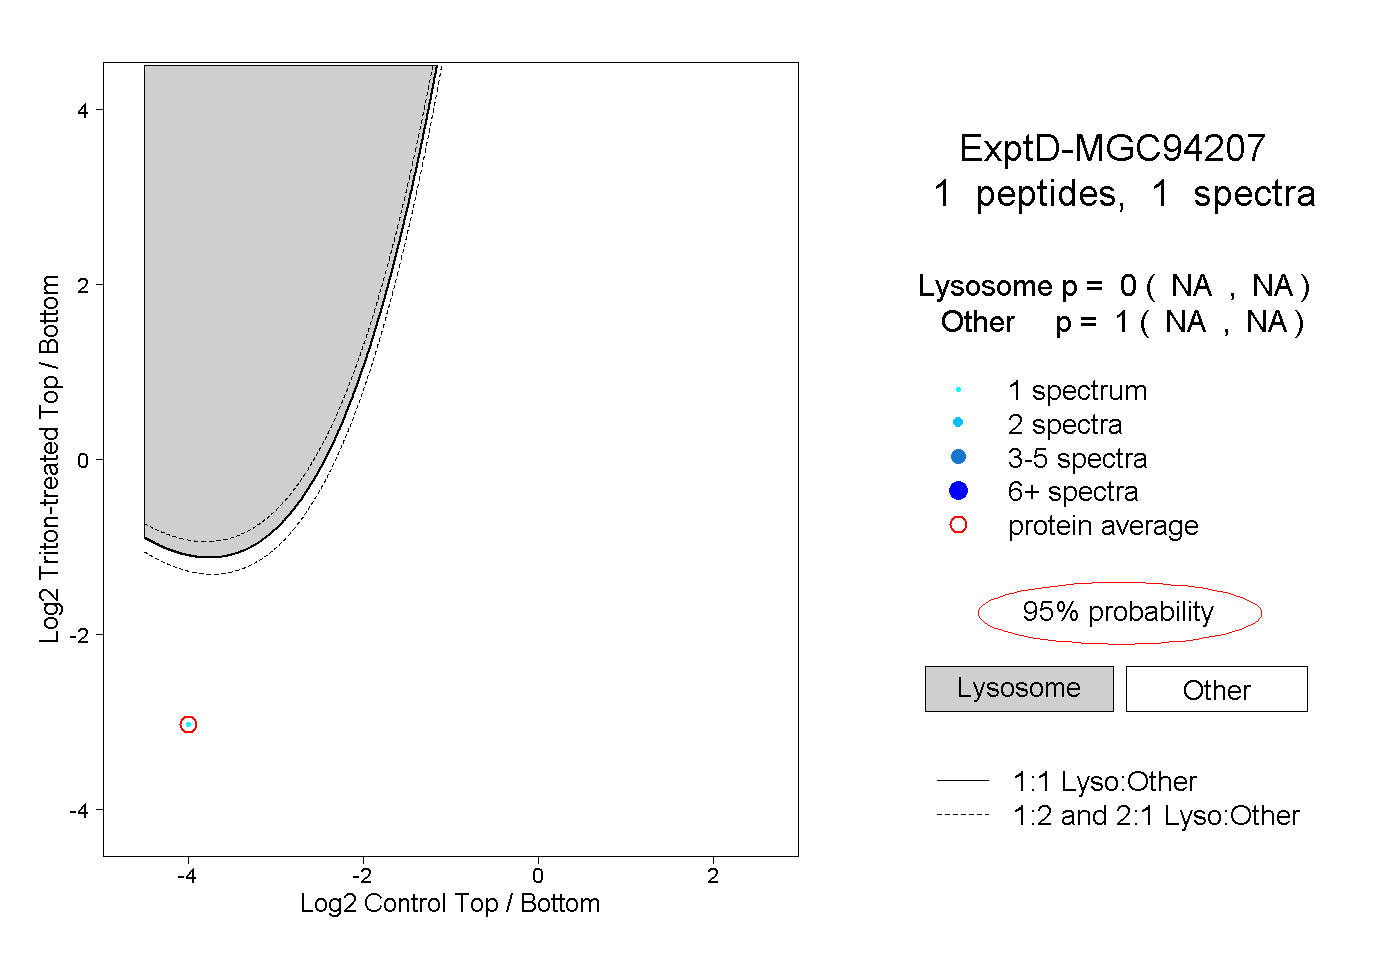
| Expt D |
1
peptide |
1
spectrum |
 |
|
0.000
NA | NA |
|
|
|
|
|
|
|
1.000
NA | NA |