 6
6peptides
spectra
0.950 | 0.976
0.000 | 0.000
0.000 | 0.000
0.000 | 0.000
0.000 | 0.000
0.006 | 0.034
0.000 | 0.000
0.010 | 0.019
| Plot | Mito | Lyso | Perox | ER | Golgi | PM | Cytosol | Nucleus | |||||
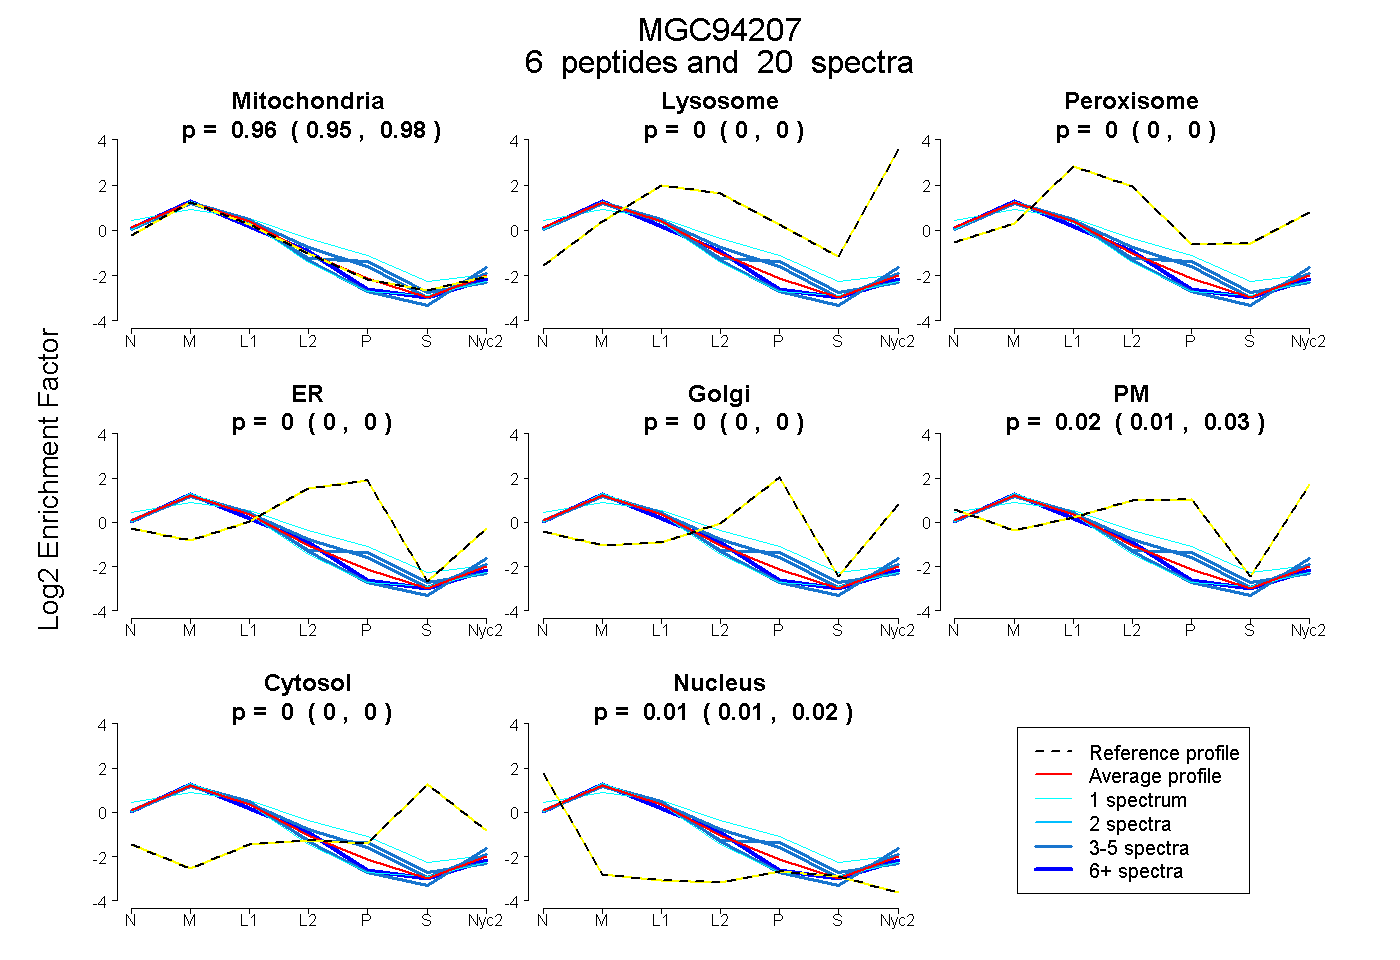
| Expt A |
6 peptides |
20 spectra |
|
0.965 0.950 | 0.976 |
0.000 0.000 | 0.000 |
0.000 0.000 | 0.000 |
0.000 0.000 | 0.000 |
0.000 0.000 | 0.000 |
0.021 0.006 | 0.034 |
0.000 0.000 | 0.000 |
0.015 0.010 | 0.019 |
| 4 spectra, NFITCFK | 0.893 | 0.000 | 0.000 | 0.101 | 0.000 | 0.005 | 0.000 | 0.000 | ||
| 1 spectrum, YEASFPFLSLCGR | 0.957 | 0.000 | 0.000 | 0.000 | 0.000 | 0.000 | 0.000 | 0.043 | ||
| 5 spectra, VSYTQGQSPEPR | 0.987 | 0.000 | 0.000 | 0.000 | 0.000 | 0.000 | 0.000 | 0.013 | ||
| 3 spectra, LYHPAPER | 0.896 | 0.000 | 0.000 | 0.078 | 0.000 | 0.000 | 0.000 | 0.026 | ||
| 1 spectrum, LRPNHSGR | 0.709 | 0.000 | 0.088 | 0.165 | 0.000 | 0.000 | 0.000 | 0.038 | ||
| 6 spectra, LLPLAANGR | 0.969 | 0.000 | 0.000 | 0.000 | 0.000 | 0.000 | 0.000 | 0.031 |
| Plot | Mito | Lyso or Perox | ER | Golgi | PM | Cytosol | Nucleus | ||||||
| Expt B |
6 peptides |
12 spectra |
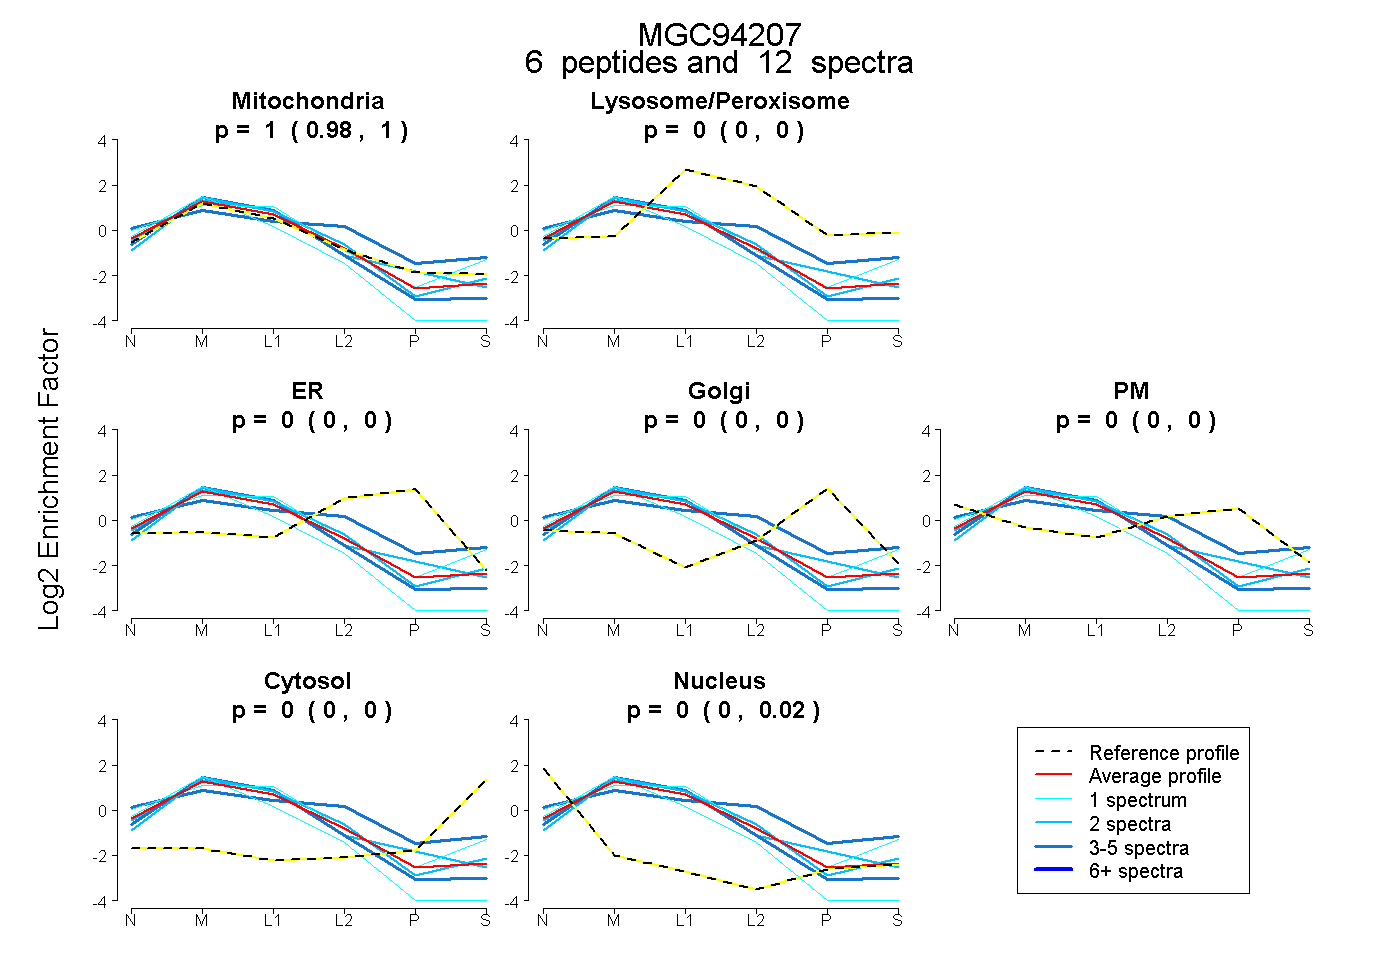 |
0.996 0.980 | 1.000 |
0.000 0.000 | 0.000 |
0.000 0.000 | 0.000 |
0.000 0.000 | 0.000 |
0.000 0.000 | 0.000 |
0.000 0.000 | 0.000 |
0.004 0.000 | 0.018 |
|||
| Plot | Lyso | Other | |||||||||||
| Expt C |
7 peptides |
60 spectra |
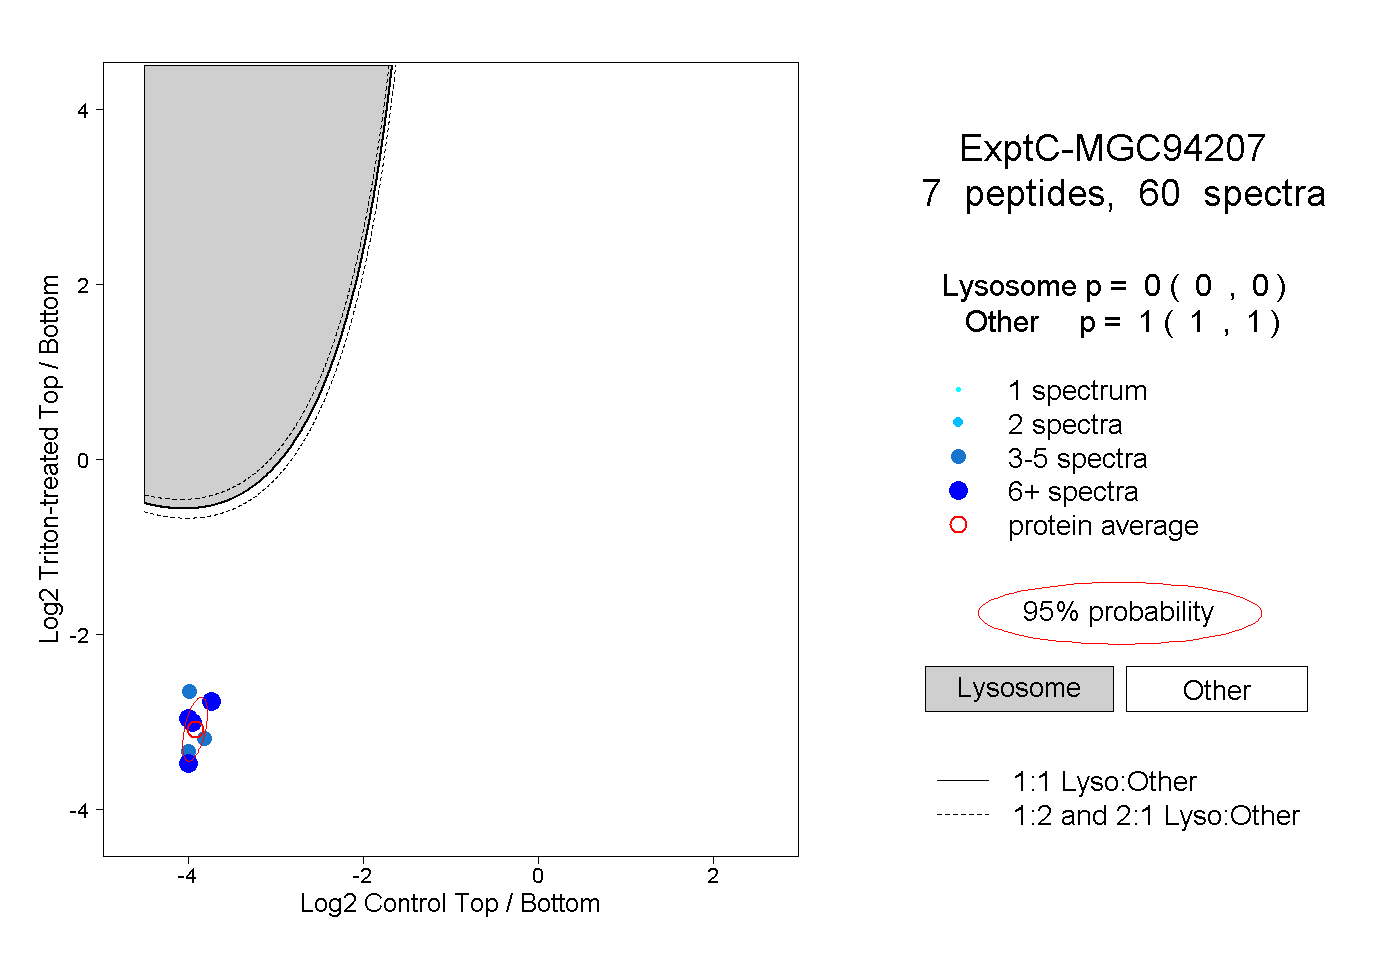 |
0.000 0.000 | 0.000 |
1.000 1.000 | 1.000 |
||||||||
| Plot | Lyso | Other | |||||||||||
| Expt D |
1 peptide |
1 spectrum |
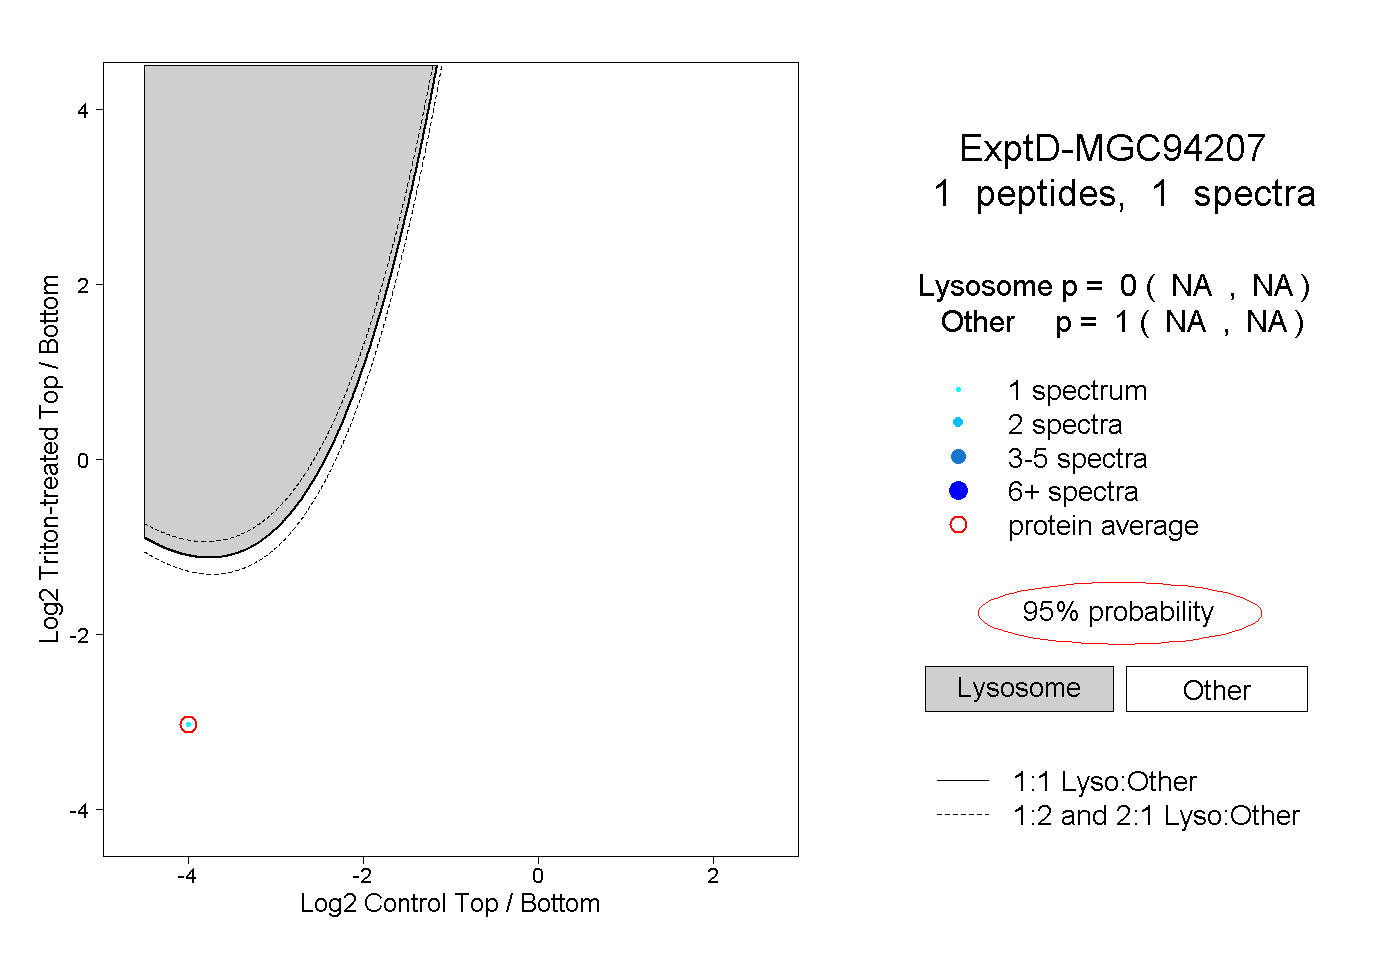 |
0.000 NA | NA |
1.000 NA | NA |