 7
7peptides
spectra

0.229 | 0.257
0.000 | 0.000
0.000 | 0.000
0.000 | 0.000
0.000 | 0.000
0.000 | 0.000
0.668 | 0.685
0.065 | 0.089
4peptides
spectra
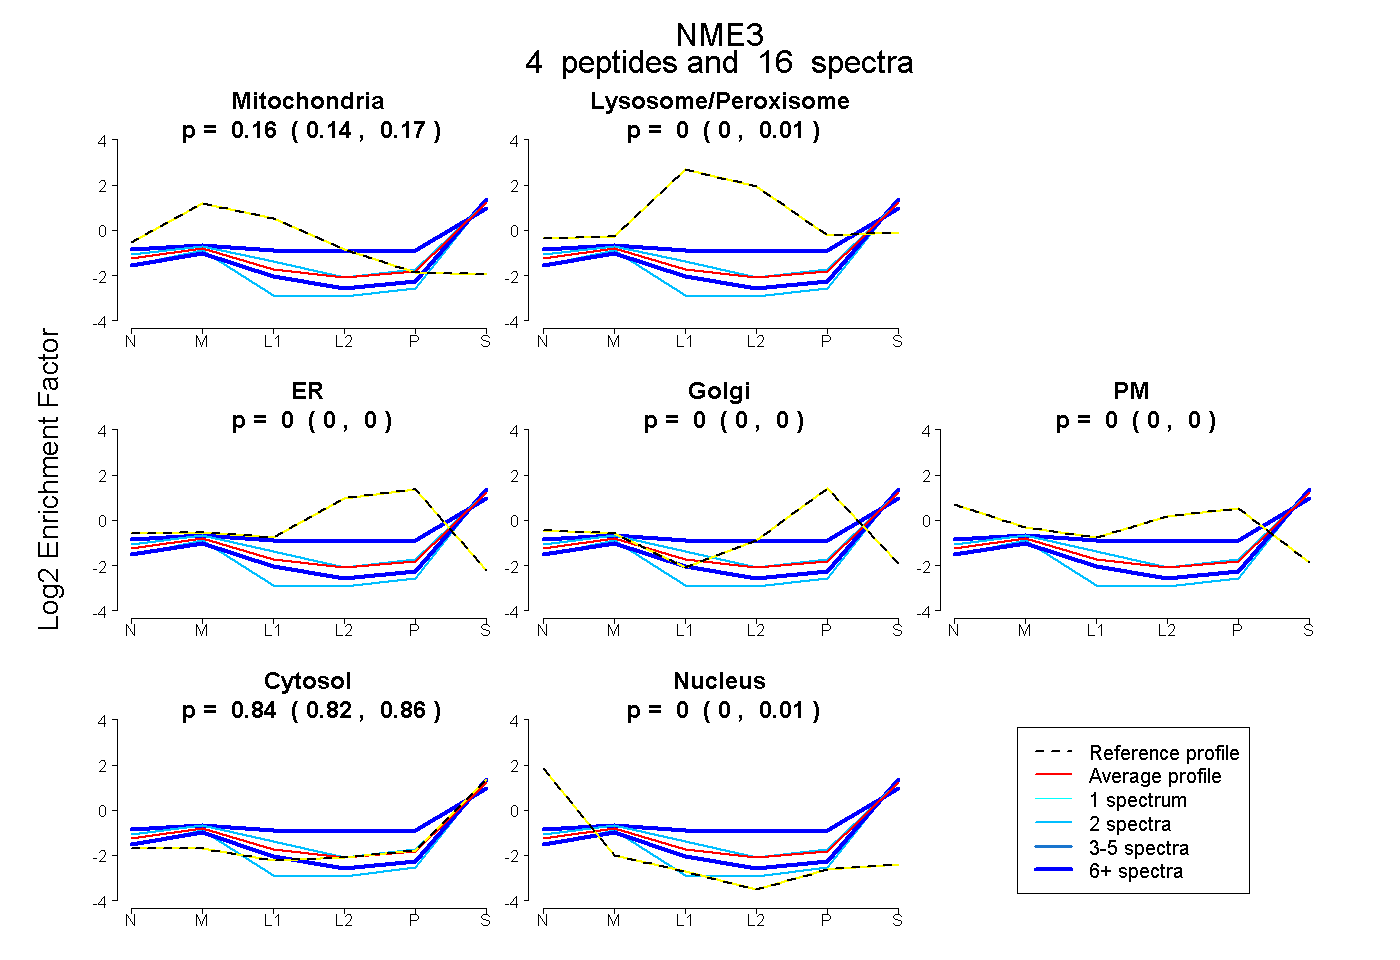
0.135 | 0.175
0.000 | 0.014
0.000 | 0.000
0.000 | 0.000
0.000 | 0.000
0.815 | 0.856
0.000 | 0.007
6peptides
spectra

0.000 | 0.000
1.000 | 1.000
1peptide
spectrum

NA | NA
NA | NA