NME3
[ENSRNOP00000021650]
Main page
| | | Plot |
Mito |
Lyso |
|
Perox |
ER |
Golgi |
PM |
Cytosol |
Nucleus |
|
| Expt A |
 7
7
peptides |
27
spectra |
 |
0.245
0.229 | 0.257 |
0.000
0.000 | 0.000 |
|
0.000
0.000 | 0.000 |
0.000
0.000 | 0.000 |
0.000
0.000 | 0.000 |
0.000
0.000 | 0.000 |
0.677
0.668 | 0.685 |
0.078
0.065 | 0.089 |
|
| | | Plot |
Mito |
|
Lyso or Perox |
|
ER |
Golgi |
PM |
Cytosol |
Nucleus |
|
| Expt B |
4
peptides |
16
spectra |
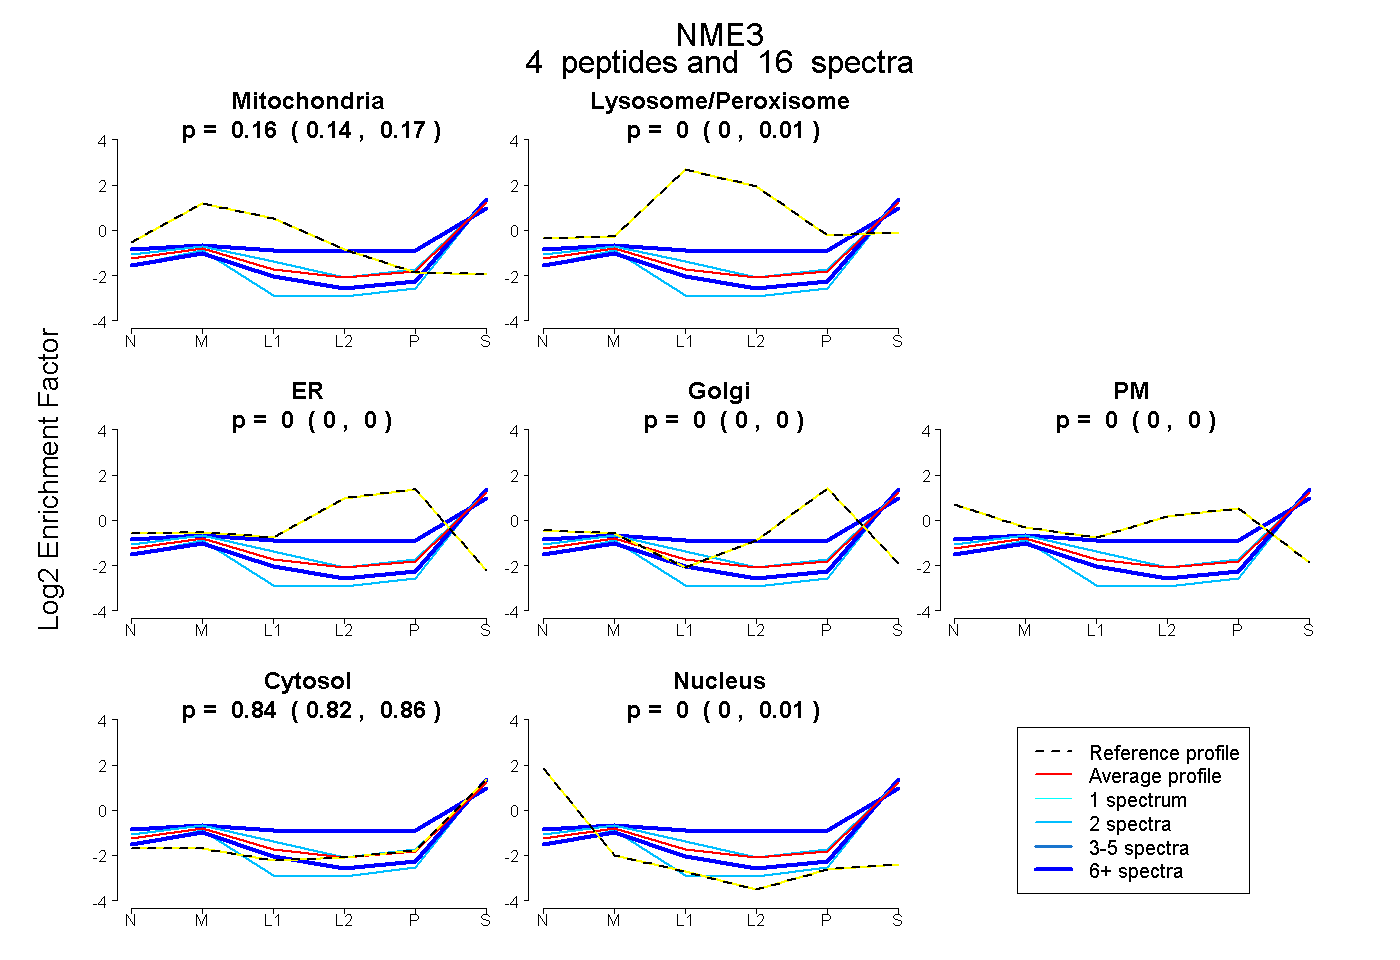 |
0.161
0.135 | 0.175 |
|
0.000
0.000 | 0.014 |
|
0.000
0.000 | 0.000 |
0.000
0.000 | 0.000 |
0.000
0.000 | 0.000 |
0.839
0.815 | 0.856 |
0.000
0.000 | 0.007 |
|
| 2 spectra, LVGEIVR |
0.000 |
|
0.000 |
|
0.000 |
0.000 |
0.000 |
0.918 |
0.082 |
|
| 6 spectra, LVQASEELLR |
0.058 |
|
0.000 |
|
0.000 |
0.000 |
0.000 |
0.919 |
0.023 |
|
| 2 spectra, TFLAVKPDGVQR |
0.196 |
|
0.019 |
|
0.000 |
0.000 |
0.000 |
0.785 |
0.000 |
|
| 6 spectra, ERPFYSR |
0.009 |
|
0.238 |
|
0.000 |
0.002 |
0.127 |
0.624 |
0.000 |
|
| | | Plot |
|
Lyso |
|
|
|
|
|
|
|
Other |
| Expt C |
6
peptides |
31
spectra |
 |
|
0.000
0.000 | 0.000 |
|
|
|
|
|
|
|
1.000
1.000 | 1.000 |
| | | Plot |
|
Lyso |
|
|
|
|
|
|
|
Other |
| Expt D |
1
peptide |
1
spectrum |
 |
|
0.000
NA | NA |
|
|
|
|
|
|
|
1.000
NA | NA |