 28
28peptides
spectra
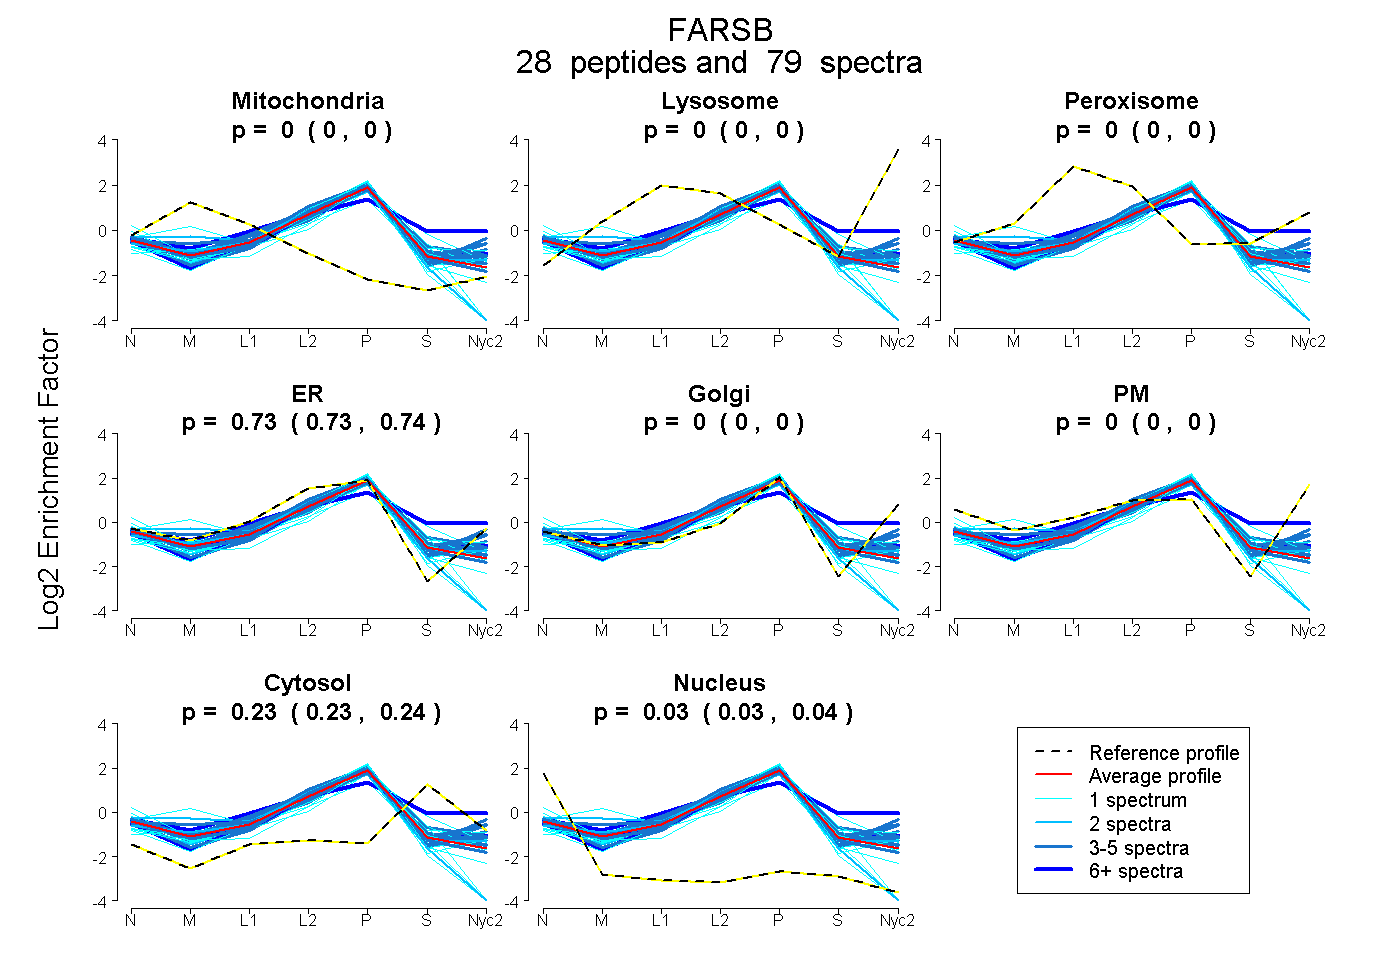
0.000 | 0.000
0.000 | 0.000
0.000 | 0.000
0.731 | 0.736
0.000 | 0.000
0.000 | 0.000
0.230 | 0.237
0.028 | 0.035
17peptides
spectra
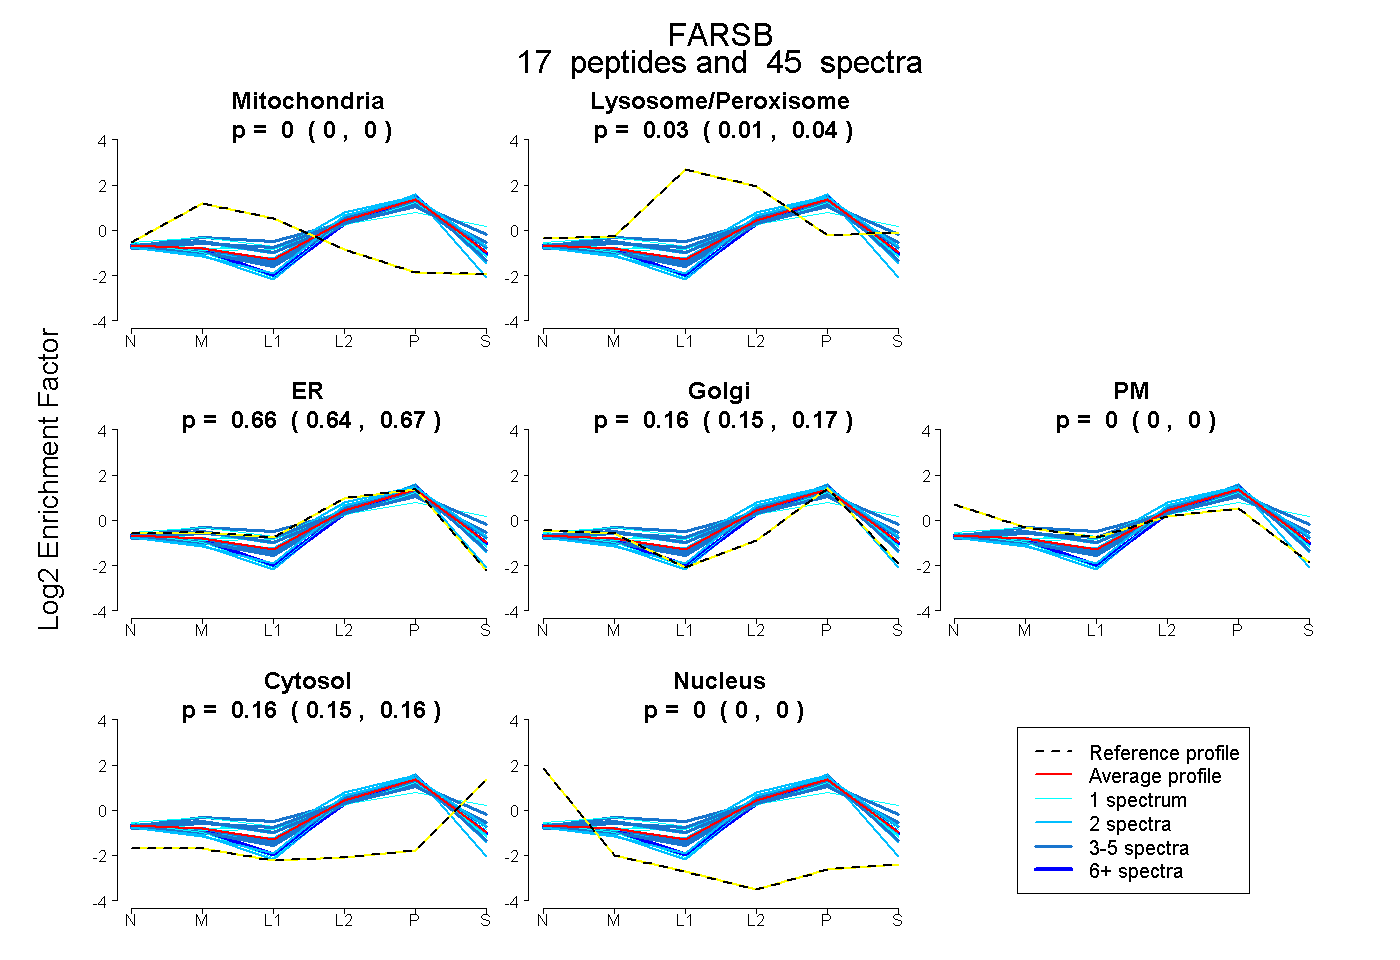
0.000 | 0.000
0.014 | 0.035
0.635 | 0.672
0.146 | 0.171
0.000 | 0.000
0.153 | 0.165
0.000 | 0.000
26peptides
spectra
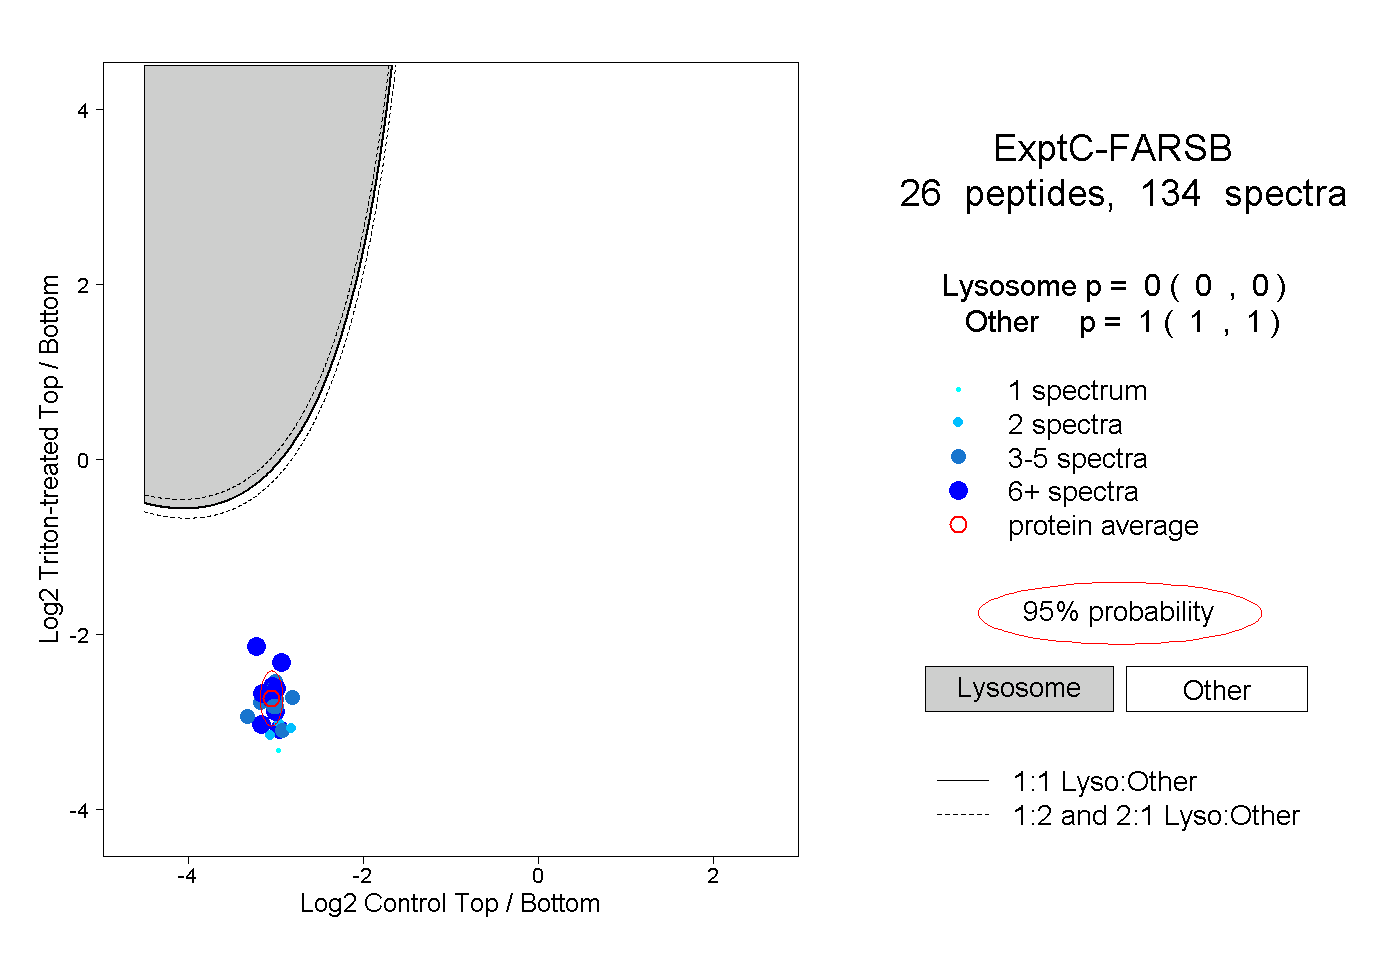
0.000 | 0.000
1.000 | 1.000
9peptides
spectra
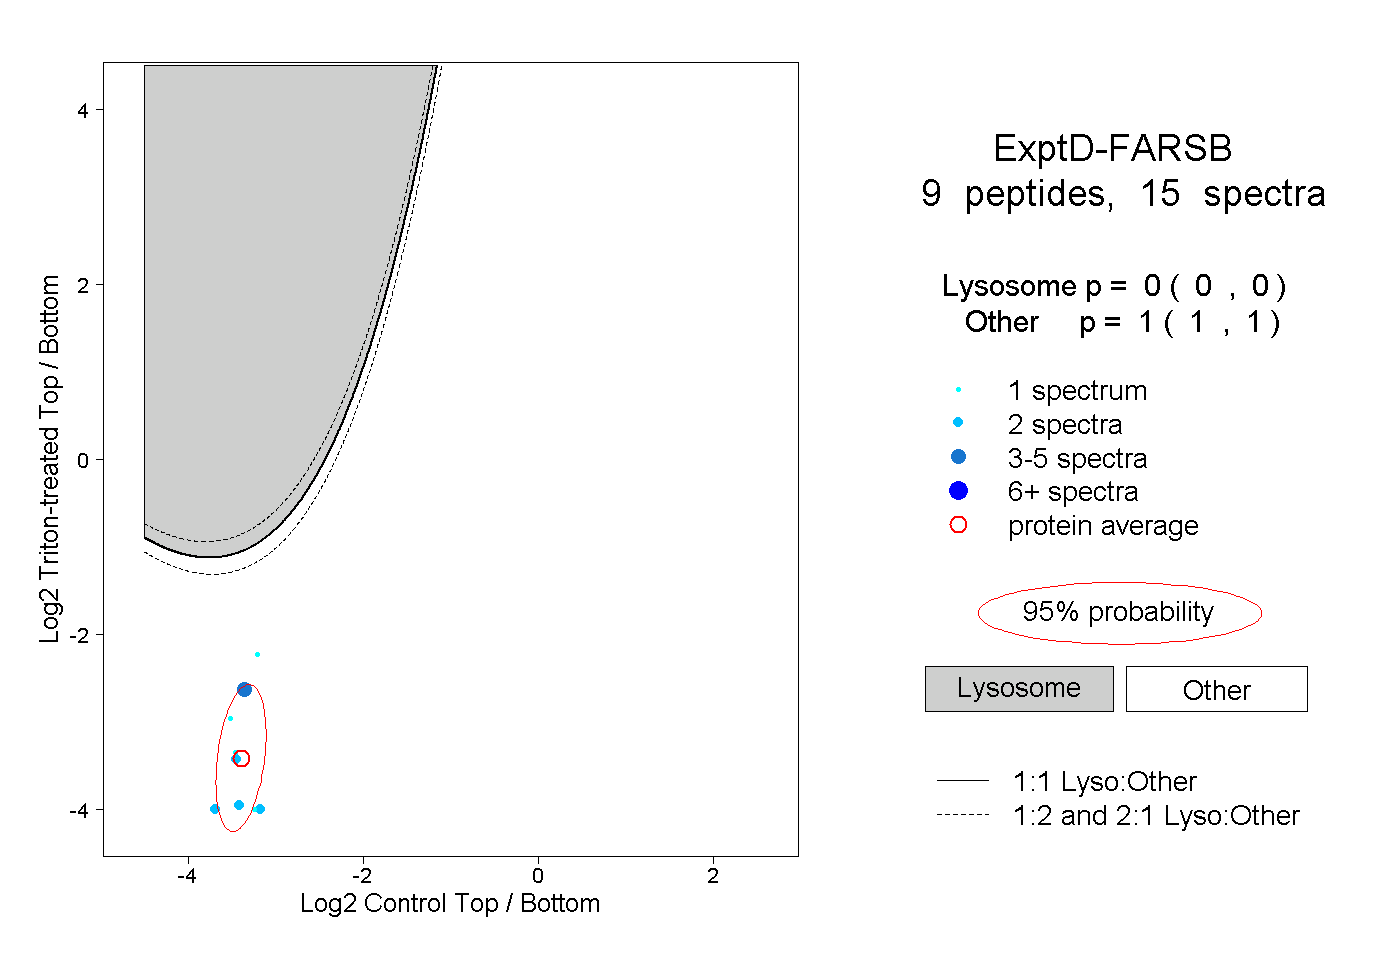
0.000 | 0.000
1.000 | 1.000