 28
28peptides
spectra
0.000 | 0.000
0.000 | 0.000
0.000 | 0.000
0.731 | 0.736
0.000 | 0.000
0.000 | 0.000
0.230 | 0.237
0.028 | 0.035
| Plot | Mito | Lyso | Perox | ER | Golgi | PM | Cytosol | Nucleus | |||||
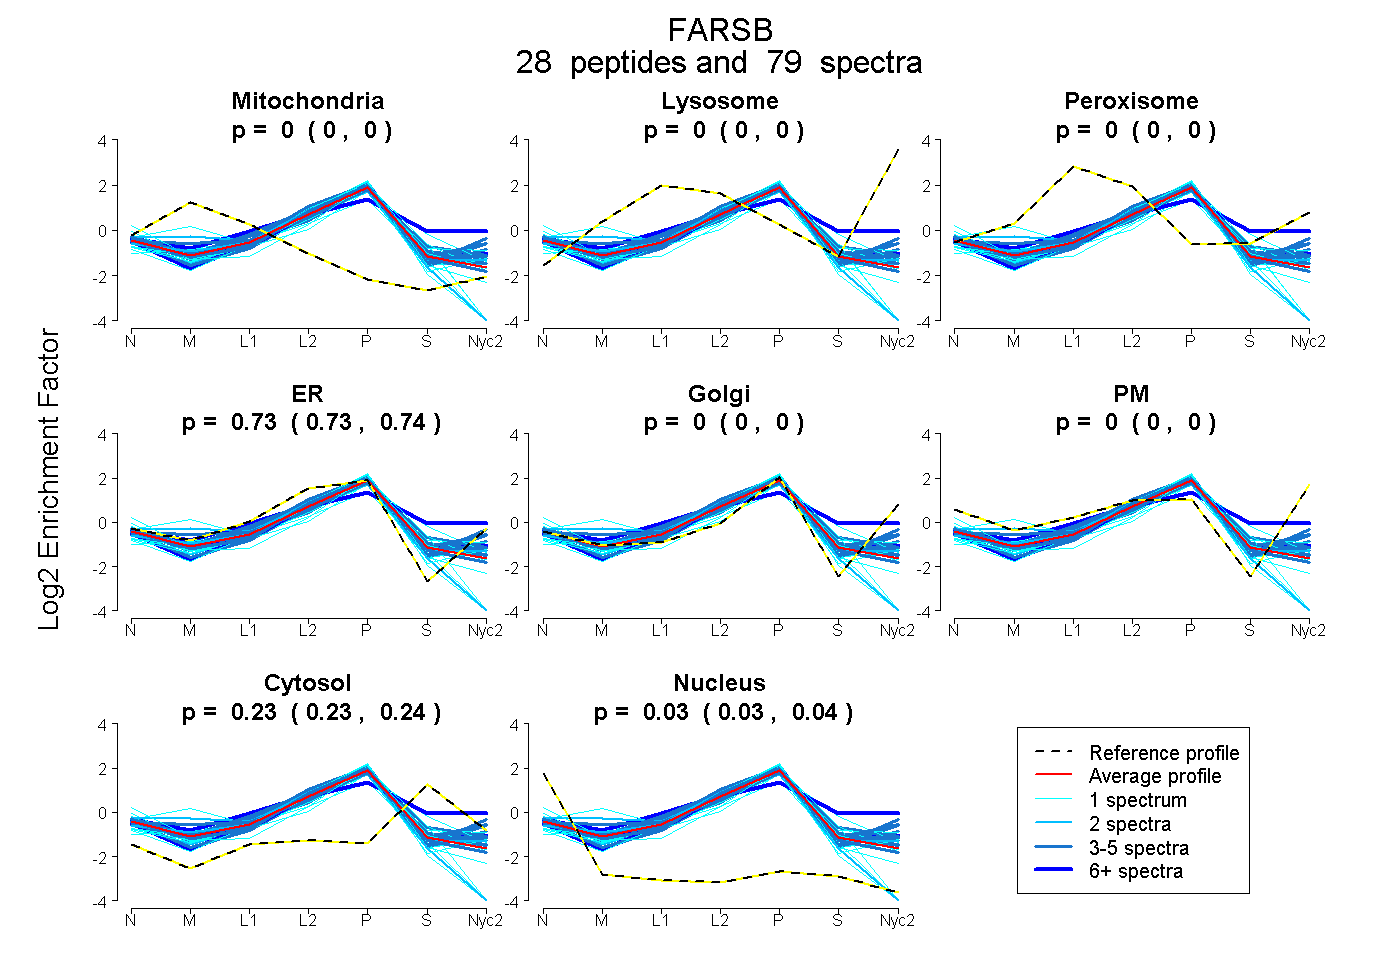
| Expt A |
28 peptides |
79 spectra |
|
0.000 0.000 | 0.000 |
0.000 0.000 | 0.000 |
0.000 0.000 | 0.000 |
0.734 0.731 | 0.736 |
0.000 0.000 | 0.000 |
0.000 0.000 | 0.000 |
0.234 0.230 | 0.237 |
0.032 0.028 | 0.035 |
| 1 spectrum, LIITEETAK | 0.000 | 0.000 | 0.000 | 0.595 | 0.000 | 0.000 | 0.405 | 0.000 | ||
| 1 spectrum, SEVIGDGNQIEVEIPPTR | 0.000 | 0.000 | 0.000 | 0.678 | 0.000 | 0.000 | 0.322 | 0.000 | ||
| 3 spectra, GLQVFK | 0.000 | 0.000 | 0.000 | 0.695 | 0.143 | 0.000 | 0.162 | 0.000 | ||
| 6 spectra, ASAGSAFFPGR | 0.000 | 0.000 | 0.000 | 0.792 | 0.000 | 0.000 | 0.208 | 0.000 | ||
| 1 spectrum, AQGASDVVLYK | 0.000 | 0.000 | 0.000 | 0.770 | 0.016 | 0.000 | 0.165 | 0.049 | ||
| 2 spectra, NIFIECTGTDLTK | 0.162 | 0.000 | 0.000 | 0.668 | 0.000 | 0.000 | 0.001 | 0.169 | ||
| 1 spectrum, EYTACELMNIYK | 0.277 | 0.000 | 0.000 | 0.536 | 0.000 | 0.000 | 0.048 | 0.138 | ||
| 4 spectra, TTLLPGLLK | 0.000 | 0.000 | 0.000 | 0.764 | 0.000 | 0.000 | 0.236 | 0.000 | ||
| 1 spectrum, LGVLHPDVITK | 0.010 | 0.000 | 0.000 | 0.780 | 0.000 | 0.000 | 0.015 | 0.195 | ||
| 3 spectra, ITVNTR | 0.000 | 0.000 | 0.000 | 0.712 | 0.000 | 0.000 | 0.262 | 0.027 | ||
| 1 spectrum, TIAANR | 0.000 | 0.000 | 0.000 | 0.796 | 0.000 | 0.000 | 0.081 | 0.122 | ||
| 2 spectra, APVYK | 0.000 | 0.000 | 0.000 | 0.775 | 0.000 | 0.000 | 0.190 | 0.035 | ||
| 4 spectra, SSTLPELPYR | 0.000 | 0.000 | 0.003 | 0.641 | 0.139 | 0.000 | 0.217 | 0.000 | ||
| 2 spectra, TYTIANQFPLNK | 0.000 | 0.000 | 0.000 | 0.781 | 0.000 | 0.000 | 0.219 | 0.000 | ||
| 3 spectra, ETPANLAK | 0.000 | 0.000 | 0.000 | 0.779 | 0.046 | 0.000 | 0.175 | 0.000 | ||
| 1 spectrum, CAEIFVGGQSIGK | 0.011 | 0.000 | 0.000 | 0.628 | 0.000 | 0.000 | 0.202 | 0.160 | ||
| 10 spectra, DLLFQVLGR | 0.000 | 0.000 | 0.000 | 0.675 | 0.041 | 0.000 | 0.284 | 0.000 | ||
| 1 spectrum, LHQNICR | 0.000 | 0.000 | 0.000 | 0.483 | 0.201 | 0.000 | 0.290 | 0.026 | ||
| 4 spectra, YDLLCLEGLAR | 0.000 | 0.000 | 0.000 | 0.748 | 0.000 | 0.000 | 0.201 | 0.051 | ||
| 1 spectrum, LGLNISATK | 0.000 | 0.000 | 0.000 | 0.767 | 0.000 | 0.000 | 0.146 | 0.086 | ||
| 4 spectra, EQGNVK | 0.000 | 0.000 | 0.000 | 0.657 | 0.145 | 0.000 | 0.173 | 0.026 | ||
| 4 spectra, AVHIGNPK | 0.000 | 0.000 | 0.000 | 0.725 | 0.000 | 0.000 | 0.232 | 0.043 | ||
| 3 spectra, IDVPANR | 0.000 | 0.000 | 0.000 | 0.722 | 0.000 | 0.000 | 0.278 | 0.000 | ||
| 1 spectrum, IMQLLDVPPGEESGGYVIK | 0.000 | 0.000 | 0.000 | 0.608 | 0.000 | 0.000 | 0.213 | 0.179 | ||
| 1 spectrum, TDNHLK | 0.000 | 0.000 | 0.000 | 0.626 | 0.046 | 0.000 | 0.280 | 0.048 | ||
| 6 spectra, LTELIR | 0.000 | 0.073 | 0.000 | 0.474 | 0.088 | 0.000 | 0.365 | 0.000 | ||
| 3 spectra, LFEISDIVVQDPSK | 0.000 | 0.000 | 0.000 | 0.697 | 0.000 | 0.000 | 0.303 | 0.000 | ||
| 5 spectra, NPGFEIIHGLLDR | 0.000 | 0.000 | 0.000 | 0.780 | 0.000 | 0.000 | 0.220 | 0.000 |
| Plot | Mito | Lyso or Perox | ER | Golgi | PM | Cytosol | Nucleus | ||||||
| Expt B |
17 peptides |
45 spectra |
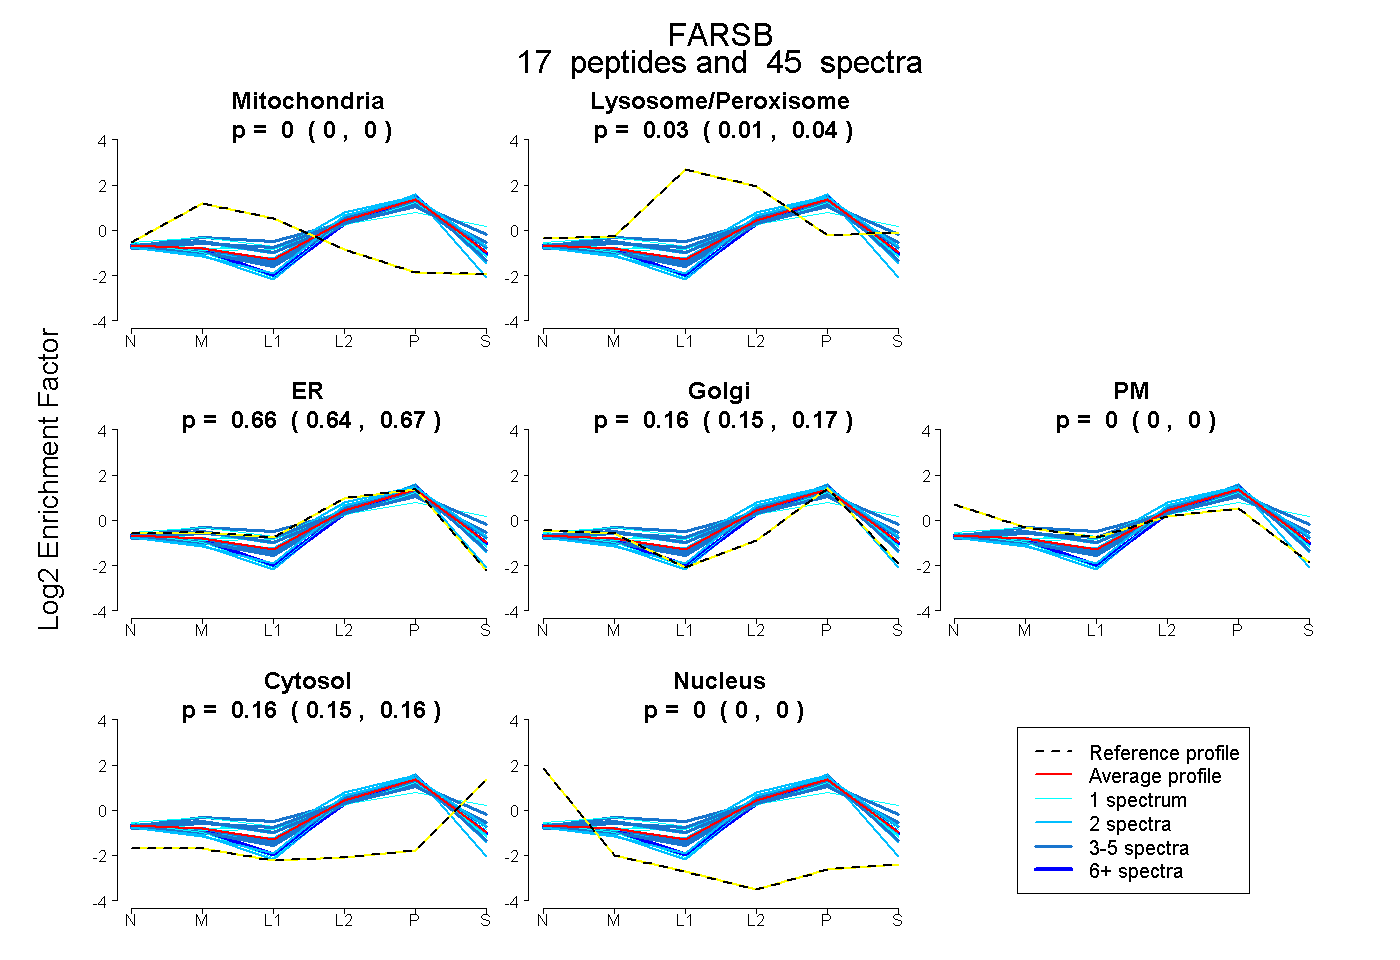 |
0.000 0.000 | 0.000 |
0.025 0.014 | 0.035 |
0.656 0.635 | 0.672 |
0.160 0.146 | 0.171 |
0.000 0.000 | 0.000 |
0.159 0.153 | 0.165 |
0.000 0.000 | 0.000 |
|||
| Plot | Lyso | Other | |||||||||||
| Expt C |
26 peptides |
134 spectra |
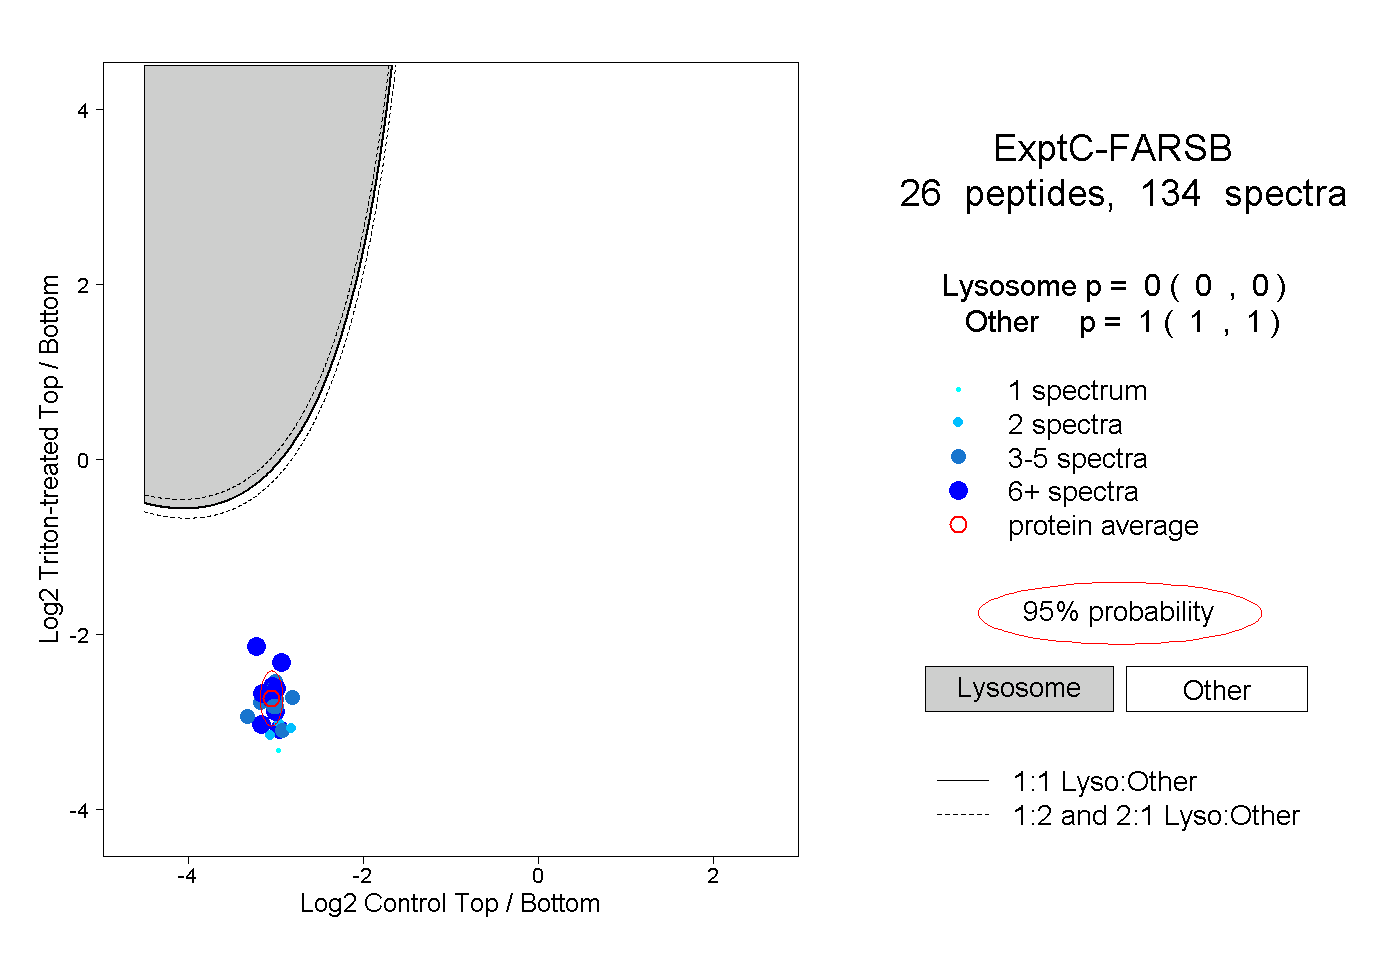 |
0.000 0.000 | 0.000 |
1.000 1.000 | 1.000 |
||||||||
| Plot | Lyso | Other | |||||||||||
| Expt D |
9 peptides |
15 spectra |
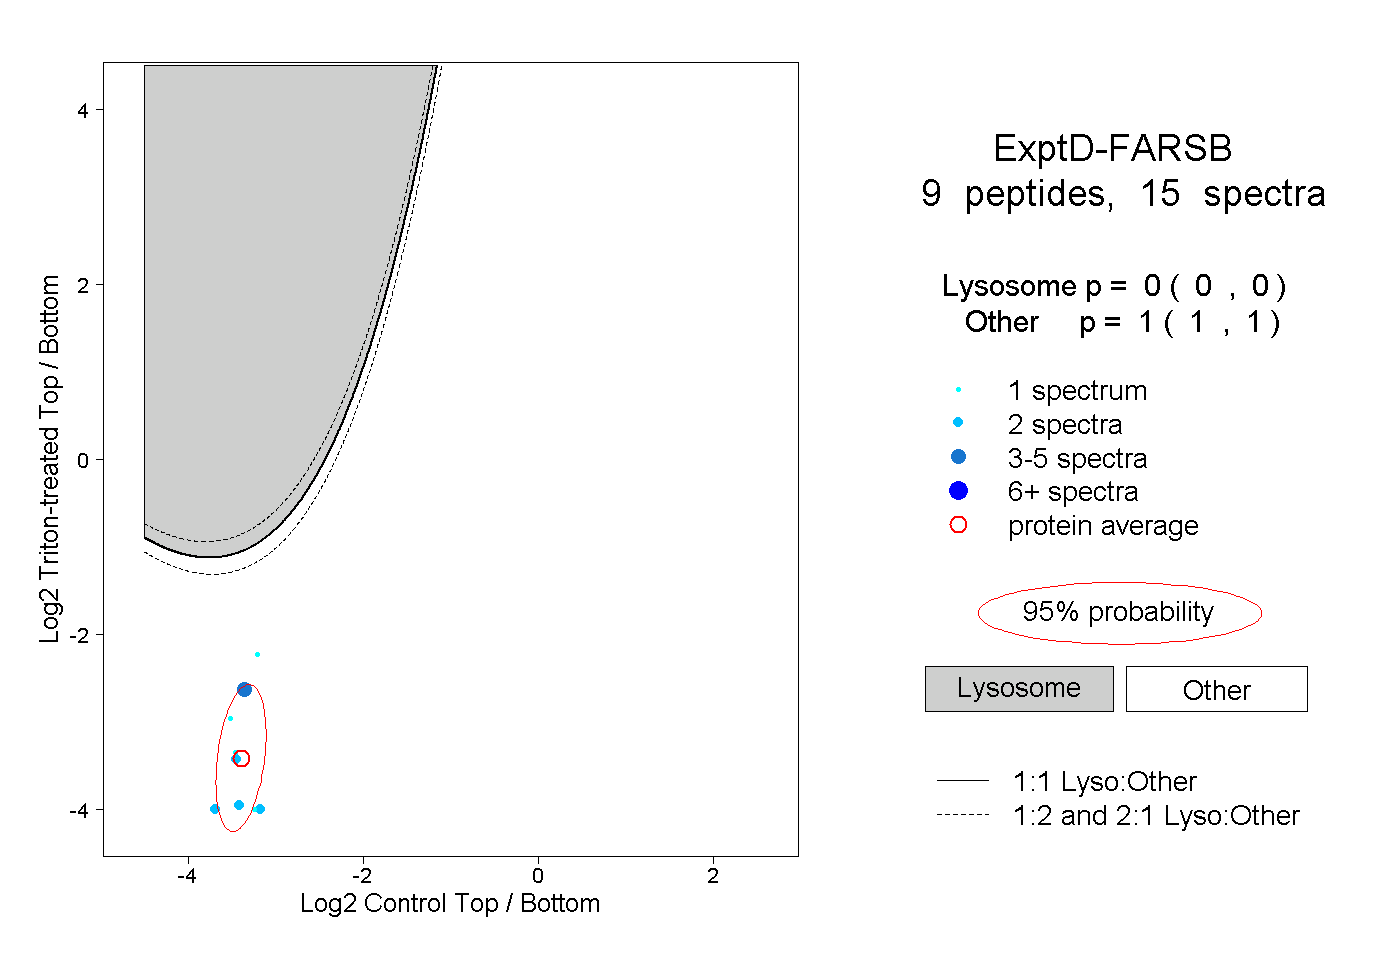 |
0.000 0.000 | 0.000 |
1.000 1.000 | 1.000 |