FARSB
[ENSRNOP00000019685]
Main page
| | | Plot |
Mito |
Lyso |
|
Perox |
ER |
Golgi |
PM |
Cytosol |
Nucleus |
|
| Expt A |
 28
28
peptides |
79
spectra |
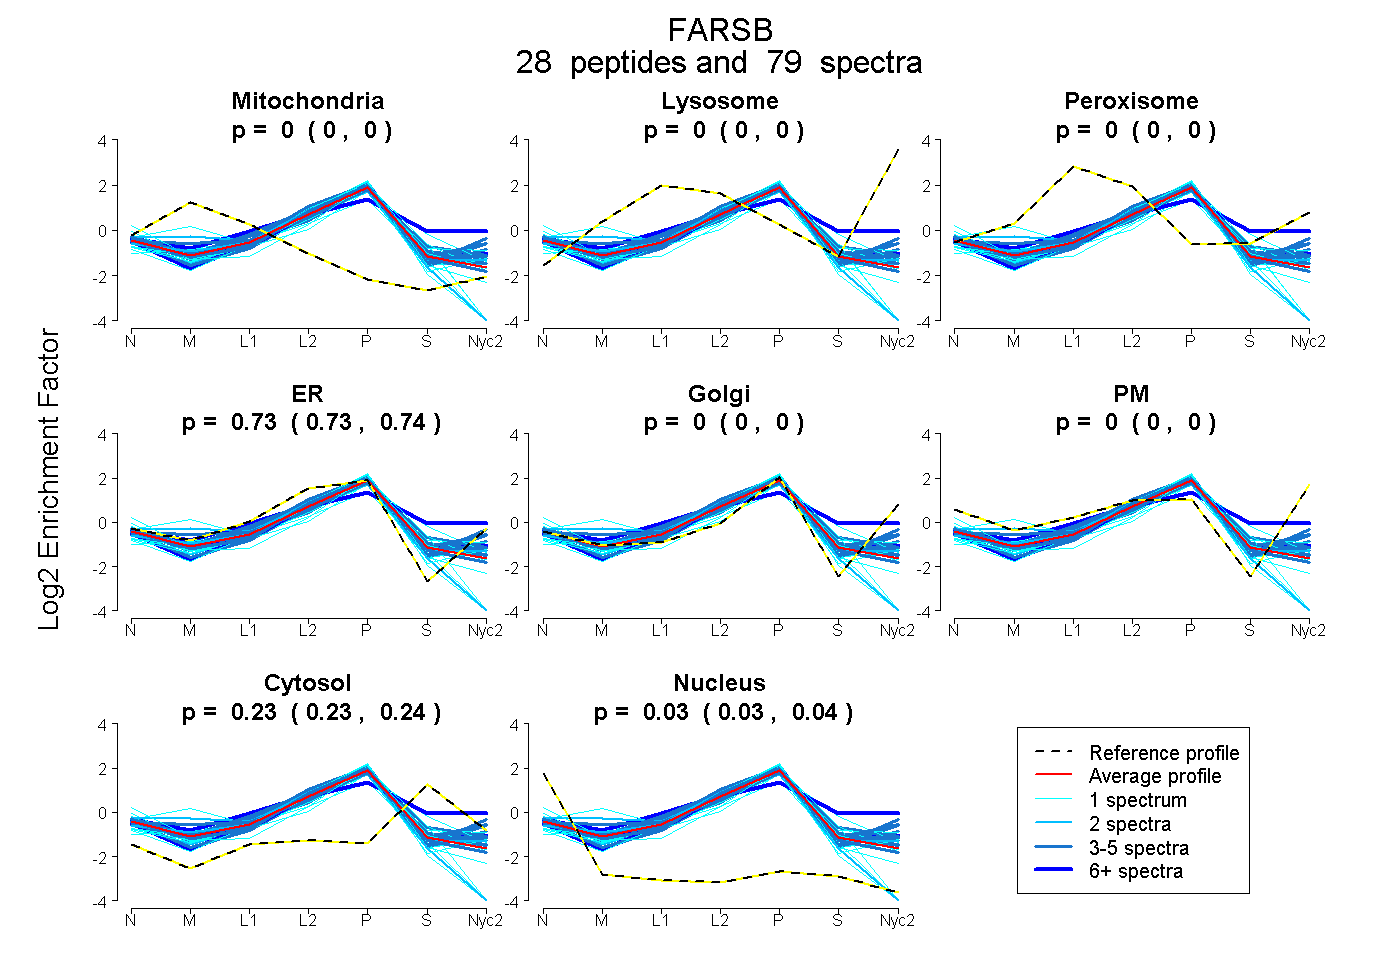 |
0.000
0.000 | 0.000 |
0.000
0.000 | 0.000 |
|
0.000
0.000 | 0.000 |
0.734
0.731 | 0.736 |
0.000
0.000 | 0.000 |
0.000
0.000 | 0.000 |
0.234
0.230 | 0.237 |
0.032
0.028 | 0.035 |
|
| | | Plot |
Mito |
|
Lyso or Perox |
|
ER |
Golgi |
PM |
Cytosol |
Nucleus |
|
| Expt B |
17
peptides |
45
spectra |
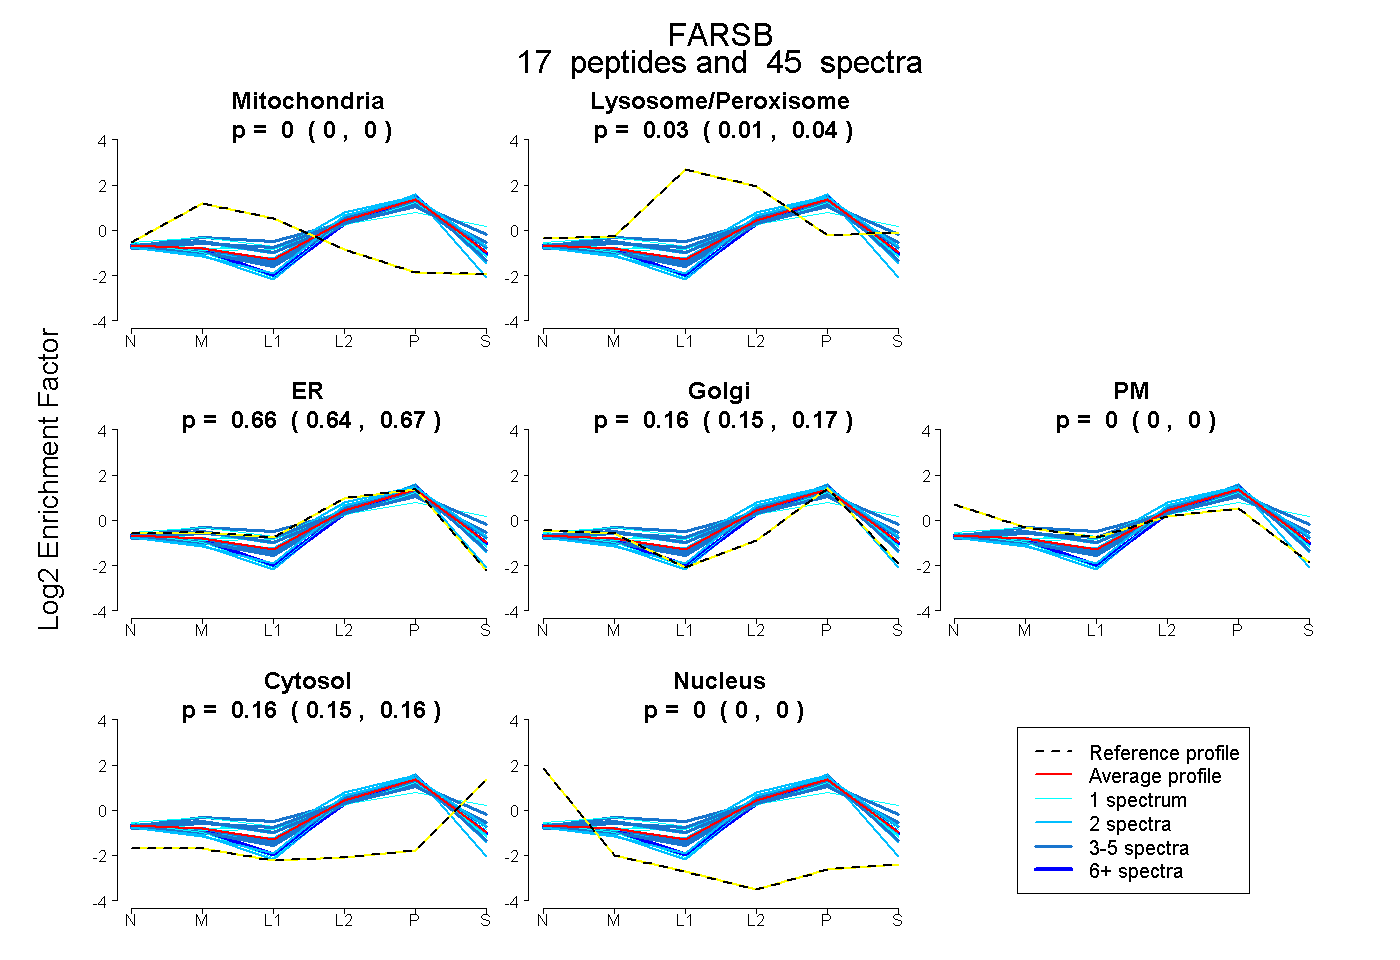 |
0.000
0.000 | 0.000 |
|
0.025
0.014 | 0.035 |
|
0.656
0.635 | 0.672 |
0.160
0.146 | 0.171 |
0.000
0.000 | 0.000 |
0.159
0.153 | 0.165 |
0.000
0.000 | 0.000 |
|
| | | Plot |
|
Lyso |
|
|
|
|
|
|
|
Other |
| Expt C |
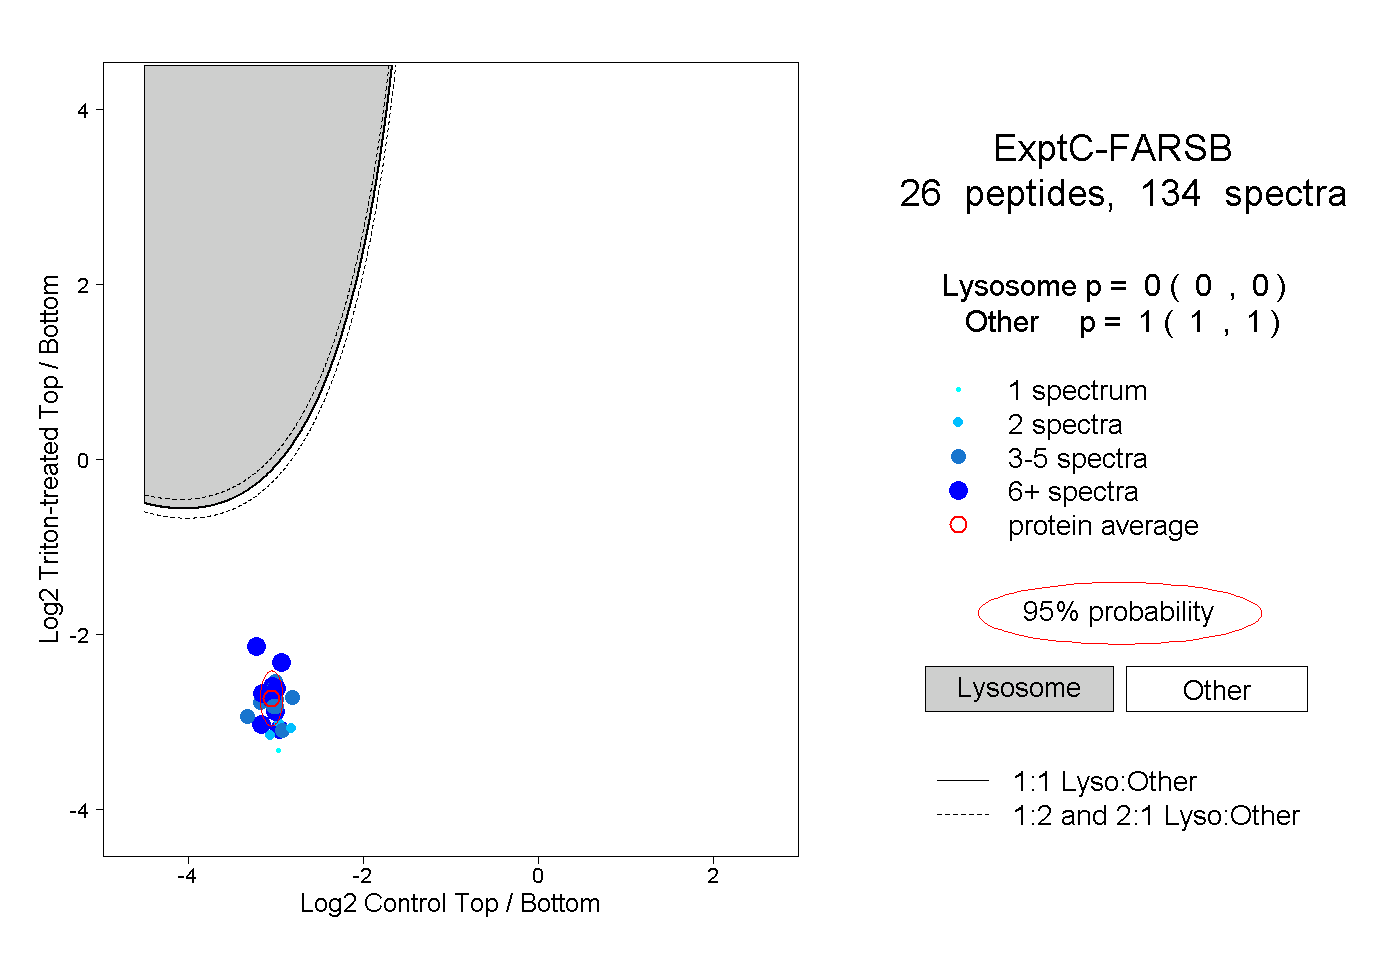
26
peptides |
134
spectra |
 |
|
0.000
0.000 | 0.000 |
|
|
|
|
|
|
|
1.000
1.000 | 1.000 |
| | | Plot |
|
Lyso |
|
|
|
|
|
|
|
Other |
| Expt D |
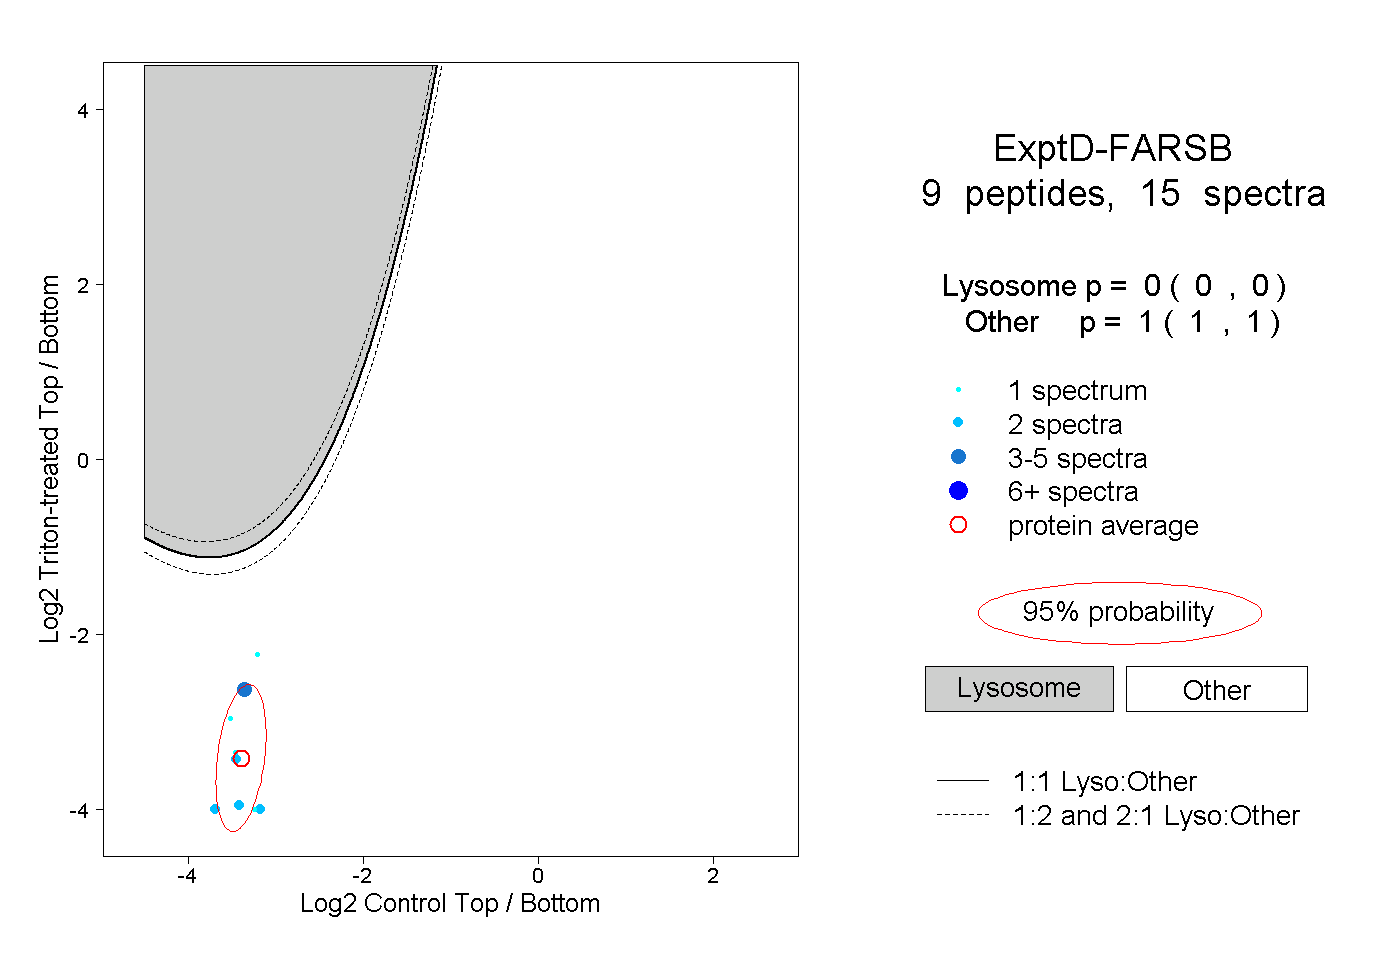
9
peptides |
15
spectra |
 |
|
0.000
0.000 | 0.000 |
|
|
|
|
|
|
|
1.000
1.000 | 1.000 |
| 1 spectrum, TYTIANQFPLNK |
|
0.000 |
|
|
|
|
|
|
|
1.000 |
| 1 spectrum, LIITEETAK |
|
0.000 |
|
|
|
|
|
|
|
1.000 |
| 2 spectra, ASAGSAFFPGR |
|
0.000 |
|
|
|
|
|
|
|
1.000 |
| 2 spectra, RPSDIK |
|
0.000 |
|
|
|
|
|
|
|
1.000 |
| 2 spectra, AQGASDVVLYK |
|
0.000 |
|
|
|
|
|
|
|
1.000 |
| 1 spectrum, LGVLHPDVITK |
|
0.000 |
|
|
|
|
|
|
|
1.000 |
| 2 spectra, HLCAVYYNK |
|
0.000 |
|
|
|
|
|
|
|
1.000 |
| 3 spectra, AVHIGNPK |
|
0.000 |
|
|
|
|
|
|
|
1.000 |
| 1 spectrum, TDNHLK |
|
0.000 |
|
|
|
|
|
|
|
1.000 |