 20
20peptides
spectra
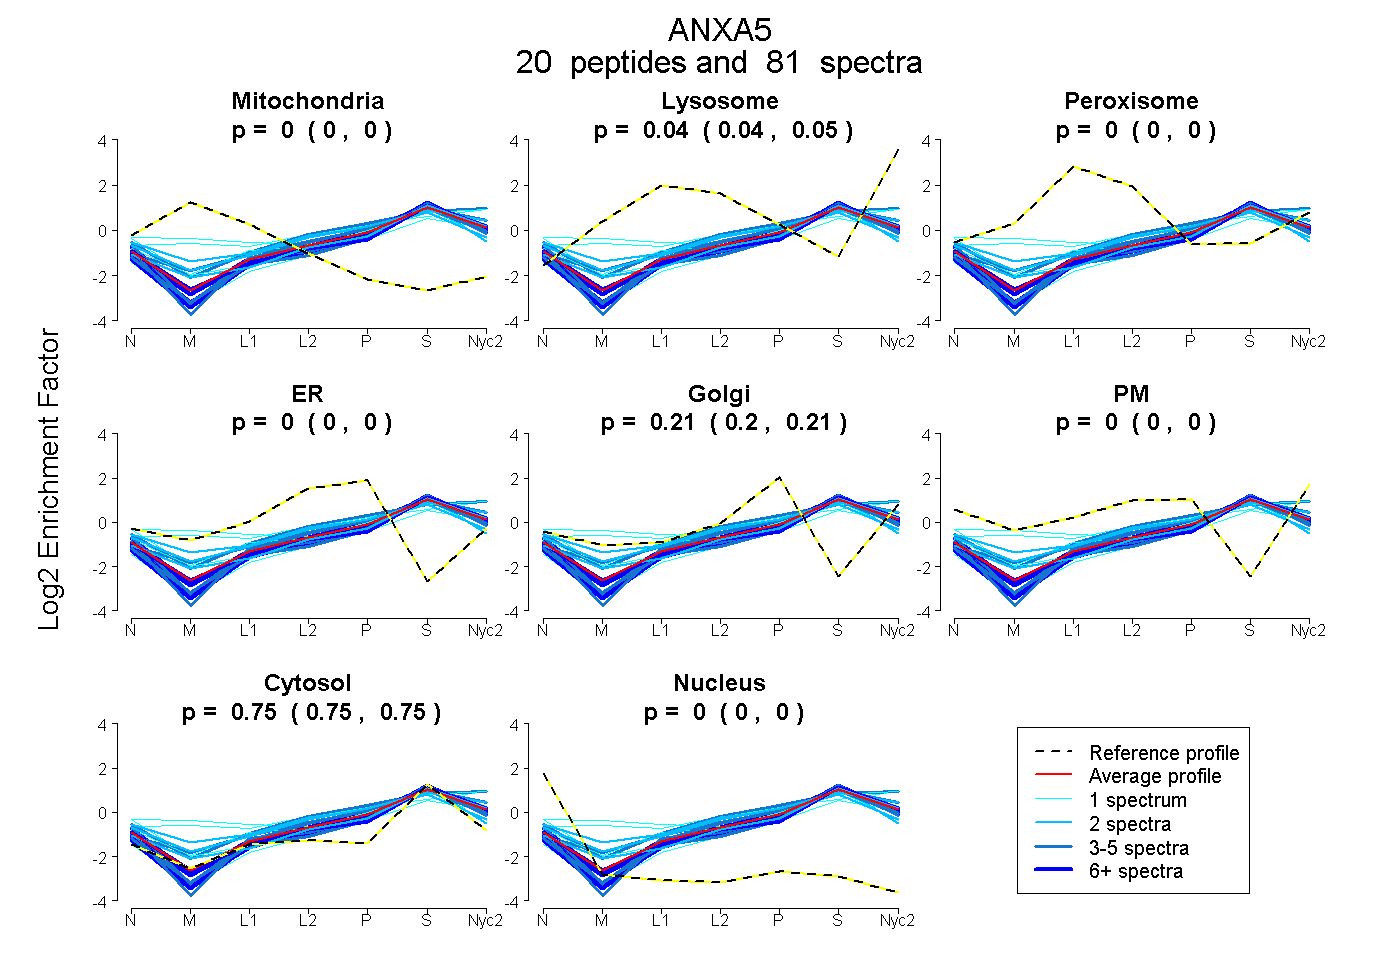
0.000 | 0.000
0.038 | 0.045
0.000 | 0.000
0.000 | 0.000
0.203 | 0.208
0.000 | 0.000
0.749 | 0.754
0.000 | 0.000
14peptides
spectra
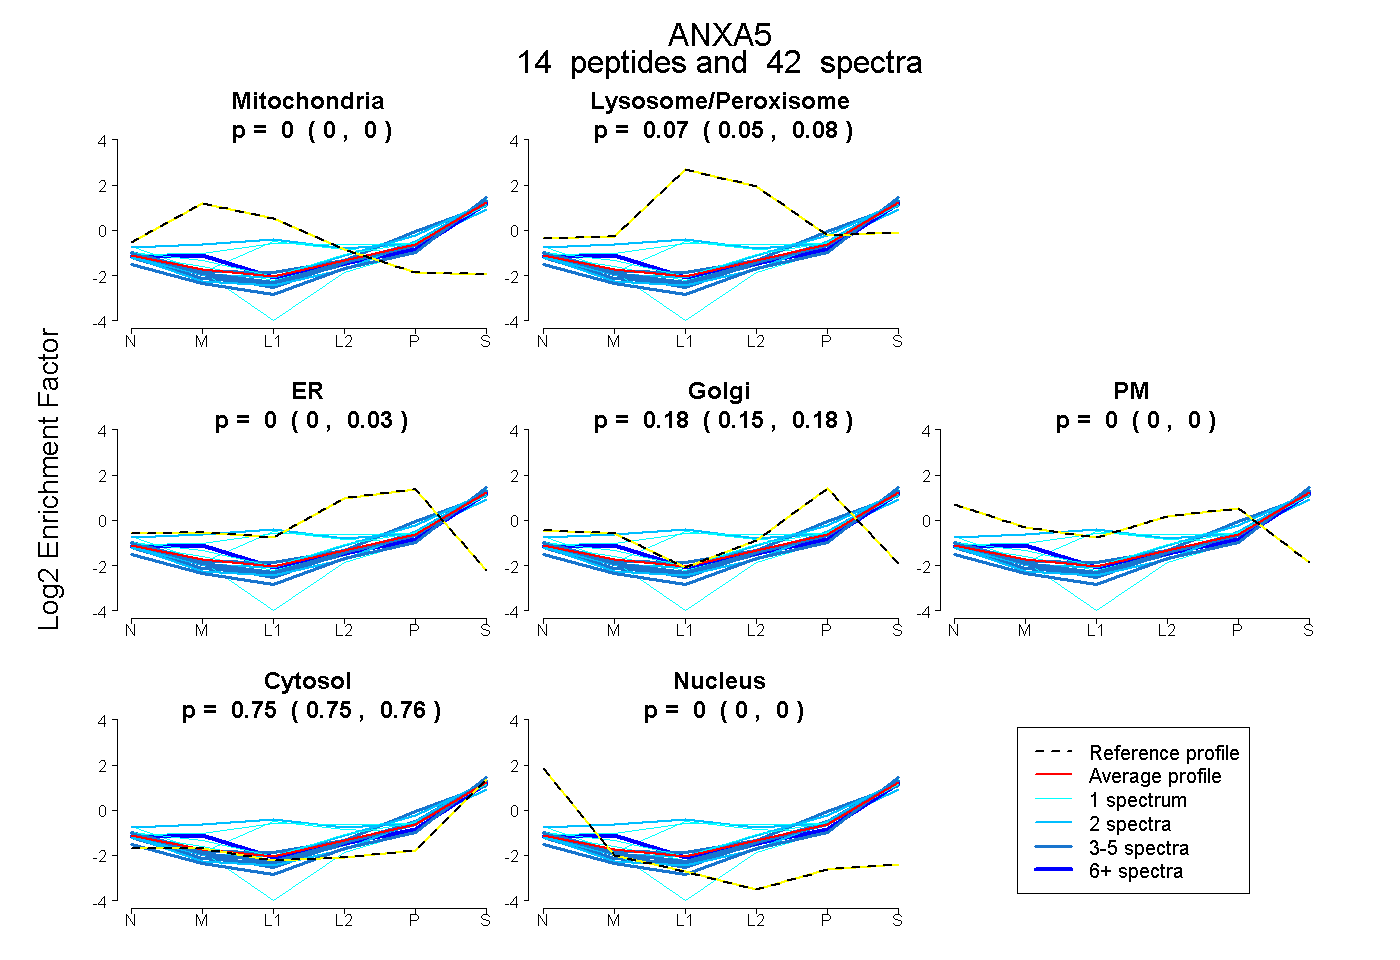
0.000 | 0.000
0.050 | 0.077
0.000 | 0.028
0.153 | 0.183
0.000 | 0.000
0.747 | 0.761
0.000 | 0.000
17peptides
spectra
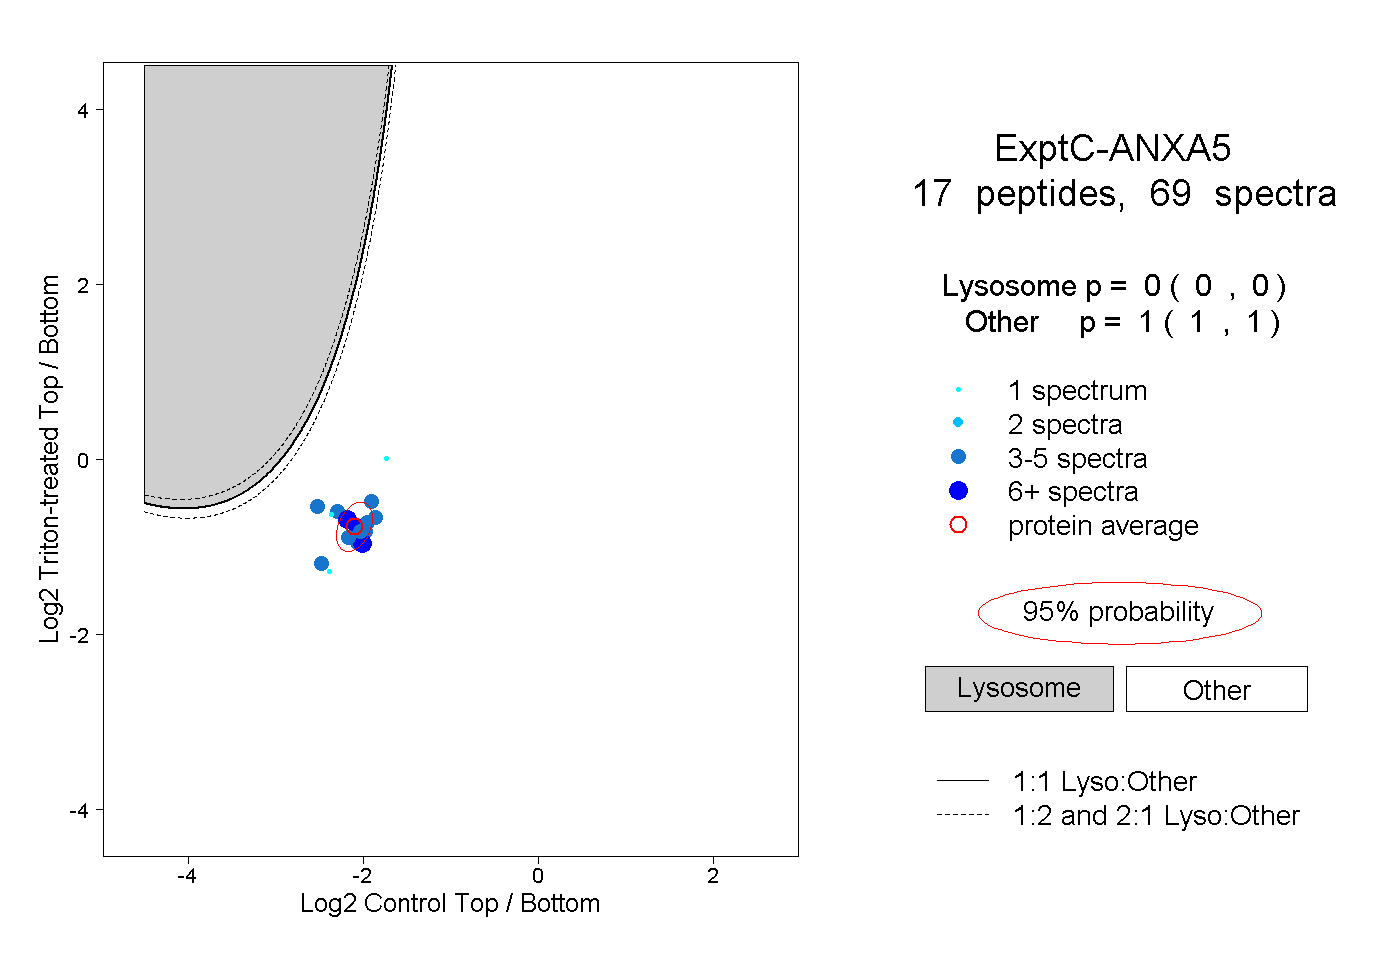
0.000 | 0.000
1.000 | 1.000
5peptides
spectra
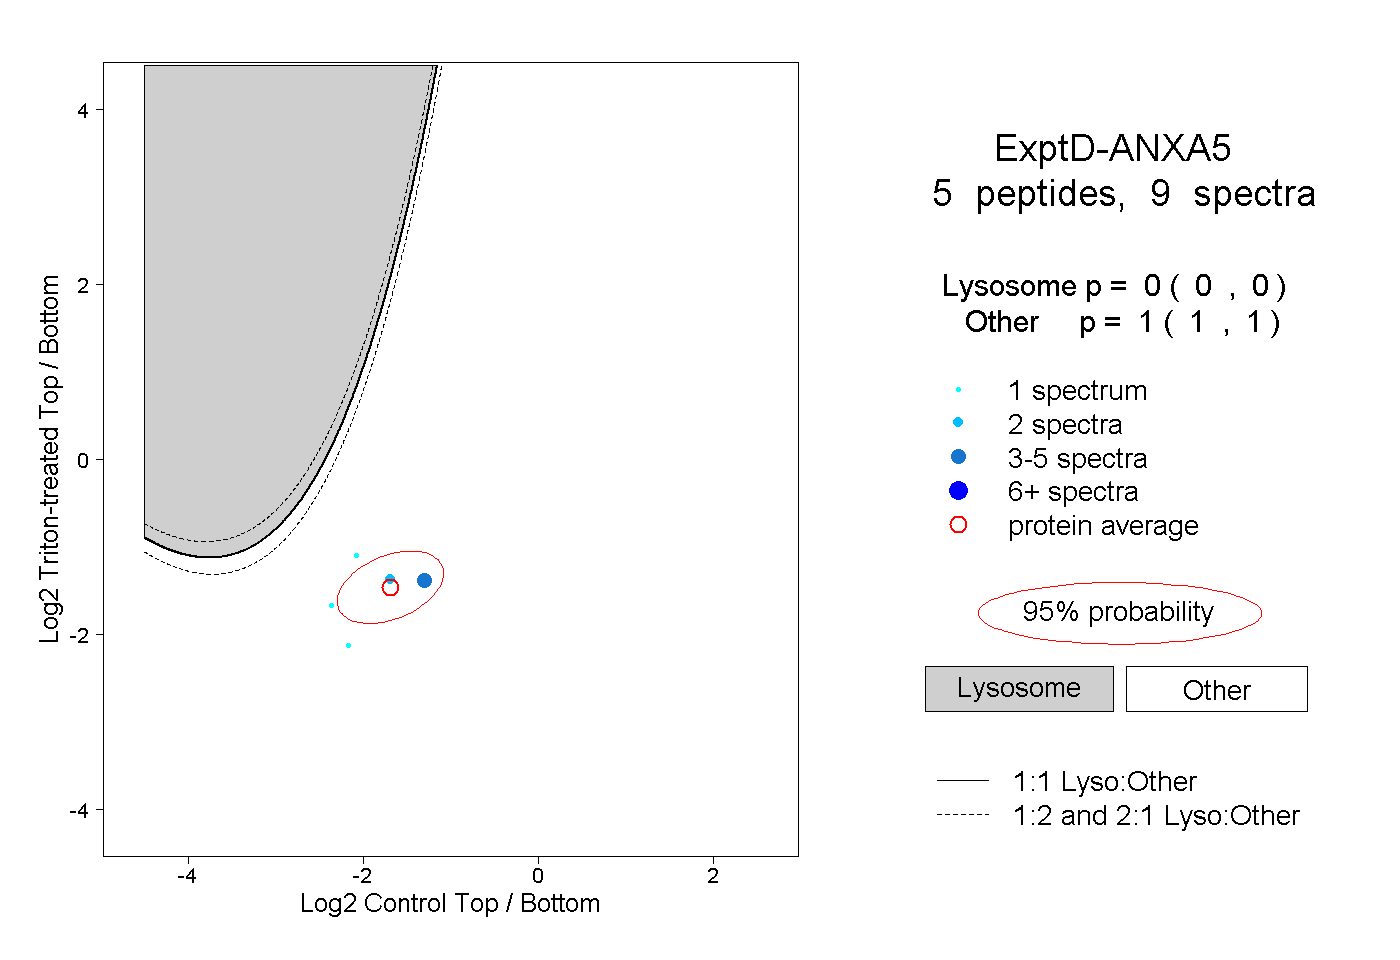
0.000 | 0.000
1.000 | 1.000