 20
20peptides
spectra
0.000 | 0.000
0.038 | 0.045
0.000 | 0.000
0.000 | 0.000
0.203 | 0.208
0.000 | 0.000
0.749 | 0.754
0.000 | 0.000
| Plot | Mito | Lyso | Perox | ER | Golgi | PM | Cytosol | Nucleus | |||||
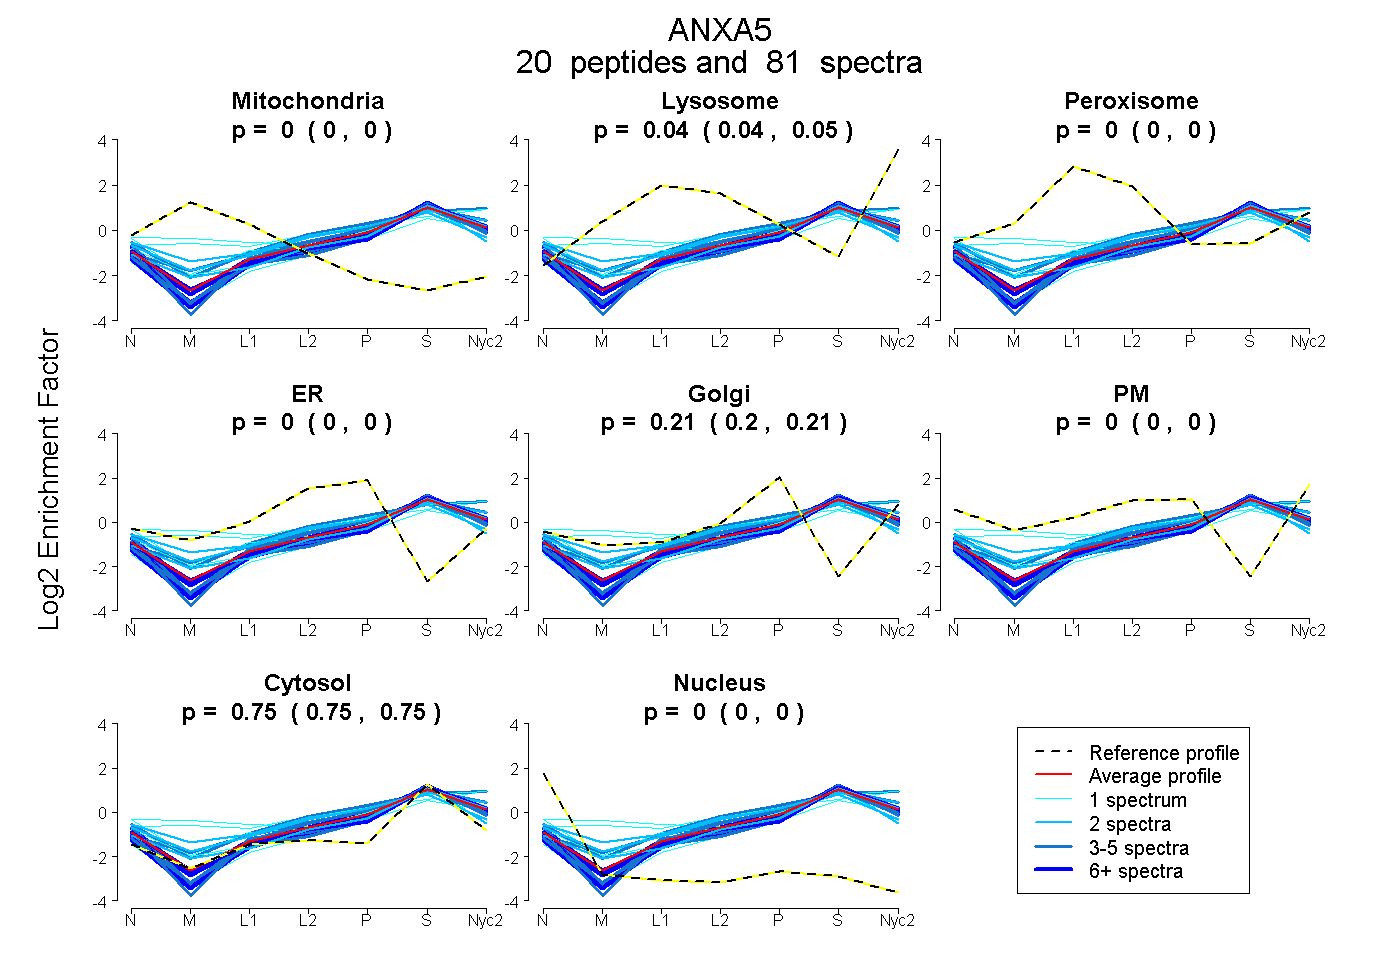
| Expt A |
20 peptides |
81 spectra |
|
0.000 0.000 | 0.000 |
0.042 0.038 | 0.045 |
0.000 0.000 | 0.000 |
0.000 0.000 | 0.000 |
0.206 0.203 | 0.208 |
0.000 0.000 | 0.000 |
0.752 0.749 | 0.754 |
0.000 0.000 | 0.000 |
| 2 spectra, YMTISGFQIEETIDR | 0.000 | 0.058 | 0.000 | 0.000 | 0.180 | 0.000 | 0.762 | 0.000 | ||
| 1 spectrum, MLVVLLQANR | 0.000 | 0.043 | 0.000 | 0.000 | 0.106 | 0.240 | 0.611 | 0.000 | ||
| 1 spectrum, ALLLLCGGEDD | 0.000 | 0.244 | 0.000 | 0.000 | 0.109 | 0.145 | 0.502 | 0.000 | ||
| 3 spectra, SIPAYLAETLYYAMK | 0.000 | 0.000 | 0.000 | 0.000 | 0.140 | 0.000 | 0.860 | 0.000 | ||
| 1 spectrum, FITILGTR | 0.000 | 0.000 | 0.000 | 0.000 | 0.161 | 0.000 | 0.839 | 0.000 | ||
| 2 spectra, GAGTDDHTLIR | 0.000 | 0.000 | 0.000 | 0.000 | 0.133 | 0.000 | 0.867 | 0.000 | ||
| 2 spectra, SVSHLR | 0.000 | 0.000 | 0.062 | 0.125 | 0.057 | 0.116 | 0.640 | 0.000 | ||
| 1 spectrum, SELTGK | 0.000 | 0.000 | 0.082 | 0.000 | 0.215 | 0.000 | 0.703 | 0.000 | ||
| 1 spectrum, ETSGNLENLLLAVVK | 0.104 | 0.063 | 0.084 | 0.000 | 0.000 | 0.216 | 0.533 | 0.000 | ||
| 8 spectra, ADAEVLR | 0.000 | 0.011 | 0.000 | 0.000 | 0.188 | 0.041 | 0.759 | 0.000 | ||
| 16 spectra, DLVNDMK | 0.000 | 0.029 | 0.000 | 0.000 | 0.191 | 0.000 | 0.781 | 0.000 | ||
| 5 spectra, SEIDLFNIR | 0.000 | 0.000 | 0.000 | 0.000 | 0.136 | 0.000 | 0.864 | 0.000 | ||
| 4 spectra, GTVTDFSGFDGR | 0.000 | 0.000 | 0.000 | 0.000 | 0.190 | 0.000 | 0.810 | 0.000 | ||
| 3 spectra, NFATSLYSMIK | 0.000 | 0.159 | 0.000 | 0.000 | 0.171 | 0.000 | 0.670 | 0.000 | ||
| 9 spectra, QQIAEEFK | 0.000 | 0.000 | 0.000 | 0.000 | 0.195 | 0.000 | 0.805 | 0.000 | ||
| 6 spectra, LYDAYELK | 0.000 | 0.000 | 0.000 | 0.000 | 0.134 | 0.000 | 0.866 | 0.000 | ||
| 6 spectra, WGTDEEK | 0.000 | 0.044 | 0.000 | 0.000 | 0.149 | 0.007 | 0.800 | 0.000 | ||
| 2 spectra, VLTEIIASR | 0.000 | 0.103 | 0.000 | 0.000 | 0.151 | 0.107 | 0.639 | 0.000 | ||
| 5 spectra, TPEEIR | 0.000 | 0.000 | 0.000 | 0.000 | 0.242 | 0.003 | 0.756 | 0.000 | ||
| 3 spectra, LIVALMKPSR | 0.000 | 0.144 | 0.000 | 0.000 | 0.142 | 0.119 | 0.594 | 0.000 |
| Plot | Mito | Lyso or Perox | ER | Golgi | PM | Cytosol | Nucleus | ||||||
| Expt B |
14 peptides |
42 spectra |
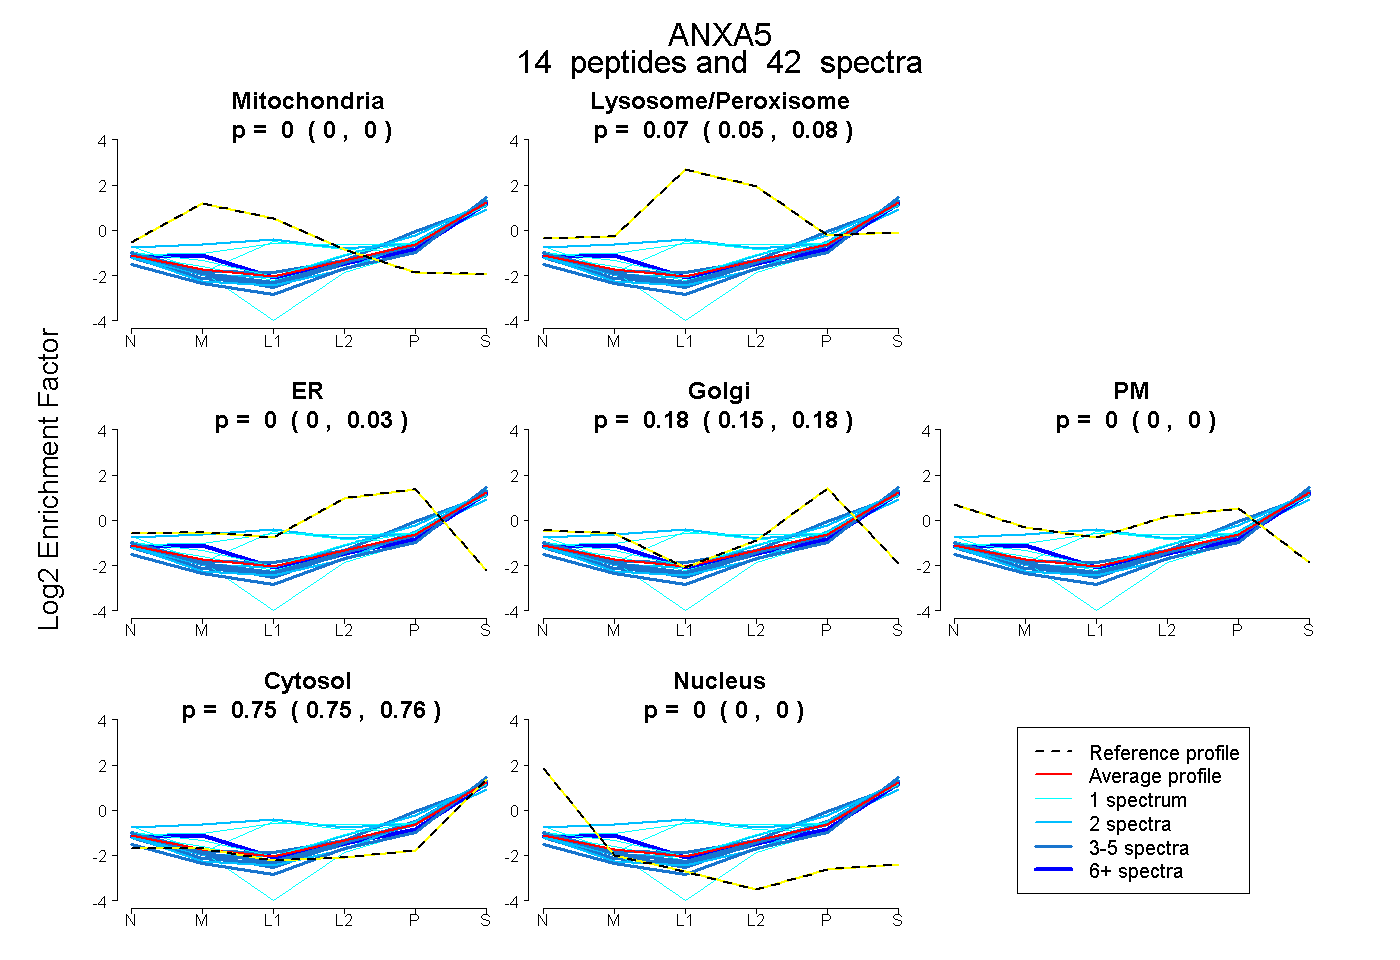 |
0.000 0.000 | 0.000 |
0.069 0.050 | 0.077 |
0.000 0.000 | 0.028 |
0.179 0.153 | 0.183 |
0.000 0.000 | 0.000 |
0.752 0.747 | 0.761 |
0.000 0.000 | 0.000 |
|||
| Plot | Lyso | Other | |||||||||||
| Expt C |
17 peptides |
69 spectra |
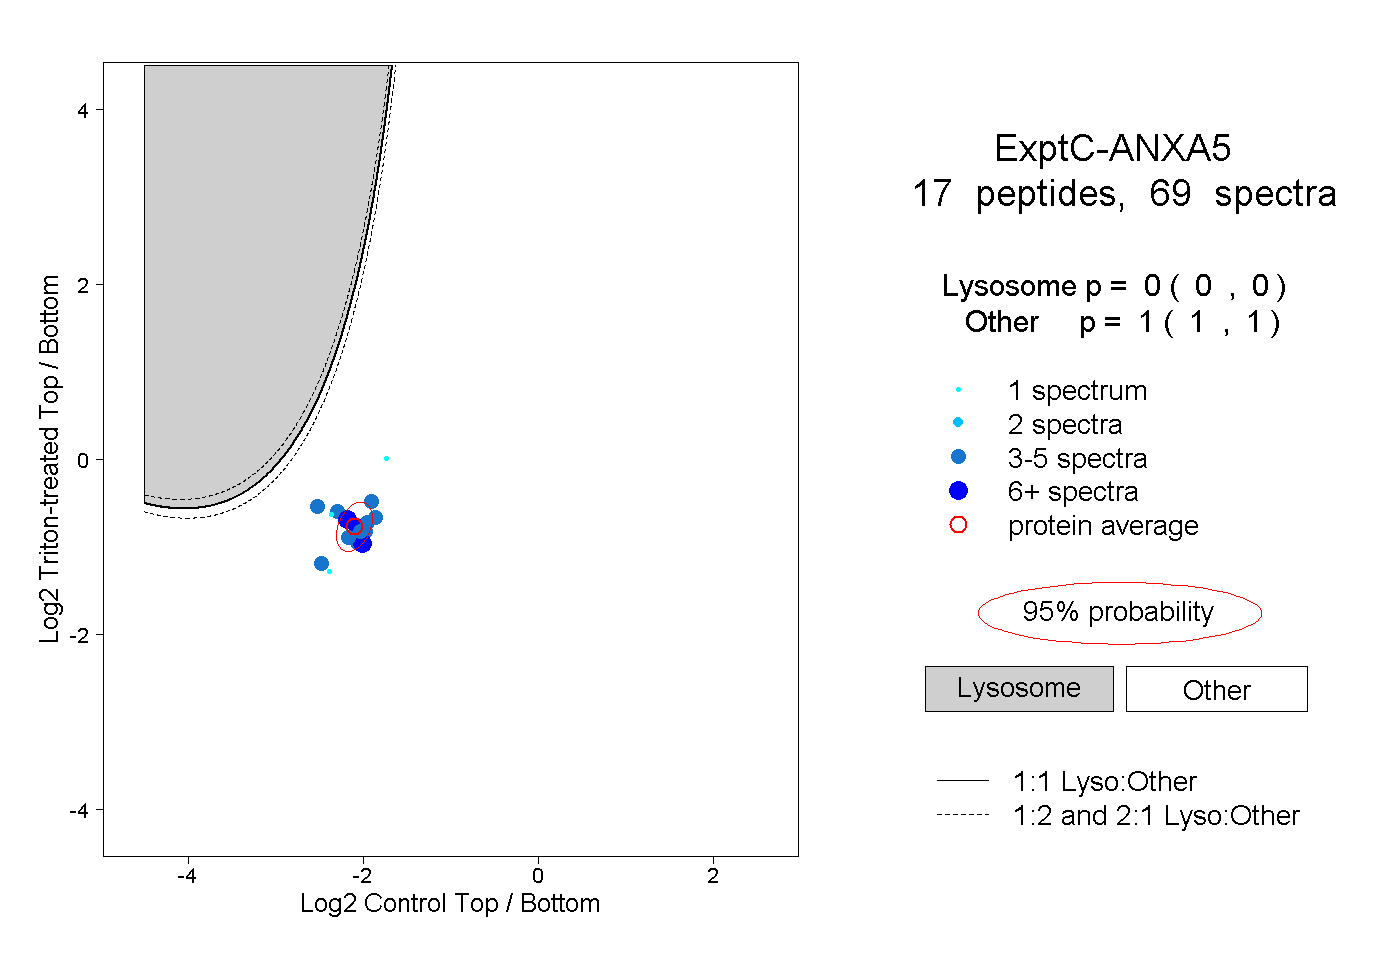 |
0.000 0.000 | 0.000 |
1.000 1.000 | 1.000 |
||||||||
| Plot | Lyso | Other | |||||||||||
| Expt D |
5 peptides |
9 spectra |
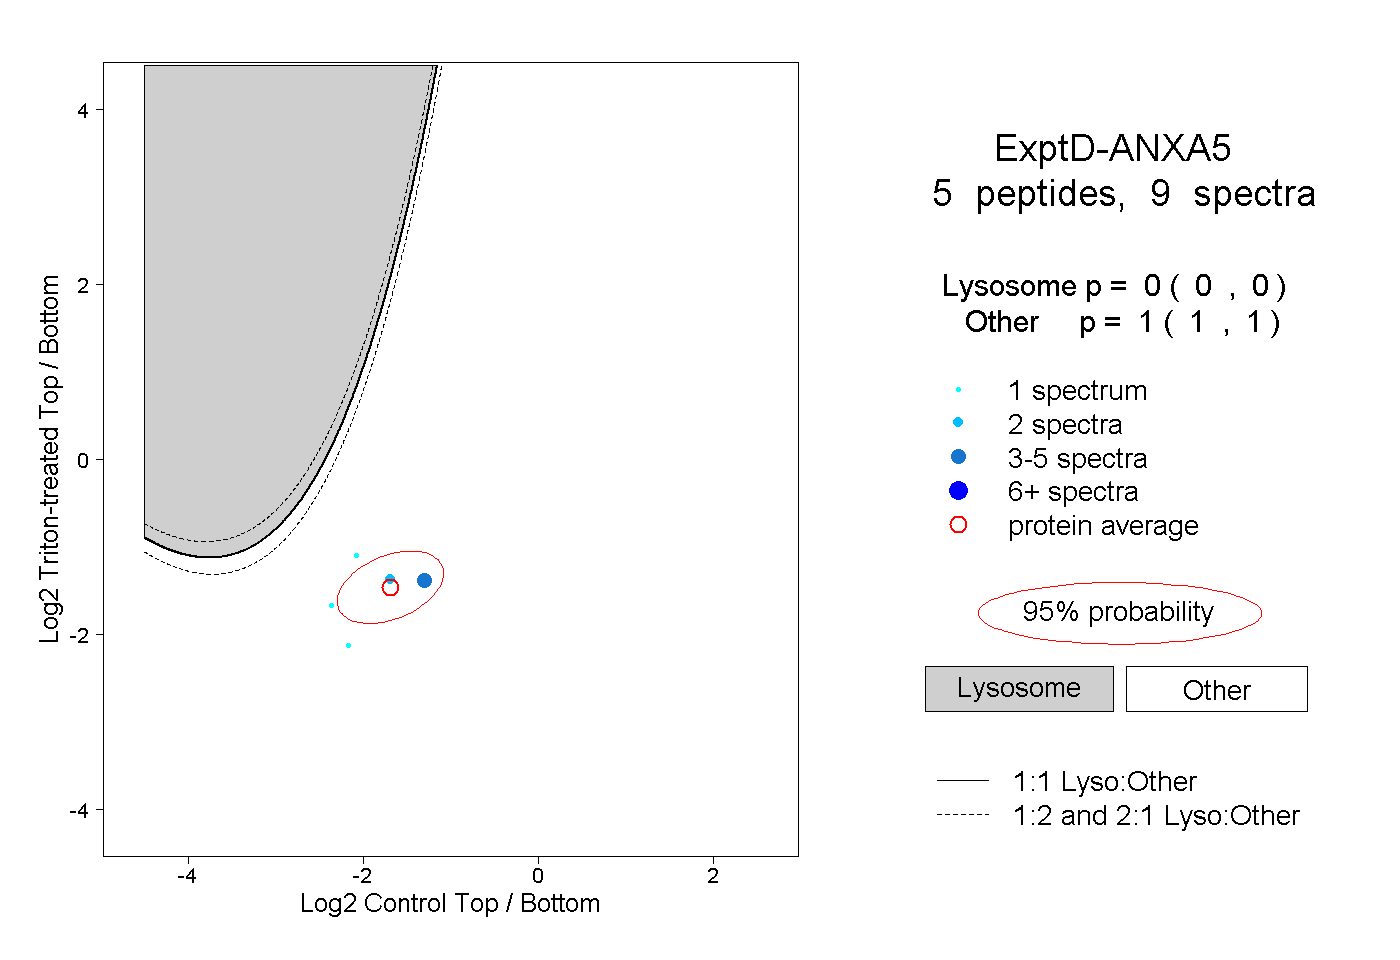 |
0.000 0.000 | 0.000 |
1.000 1.000 | 1.000 |