 27
27peptides
spectra
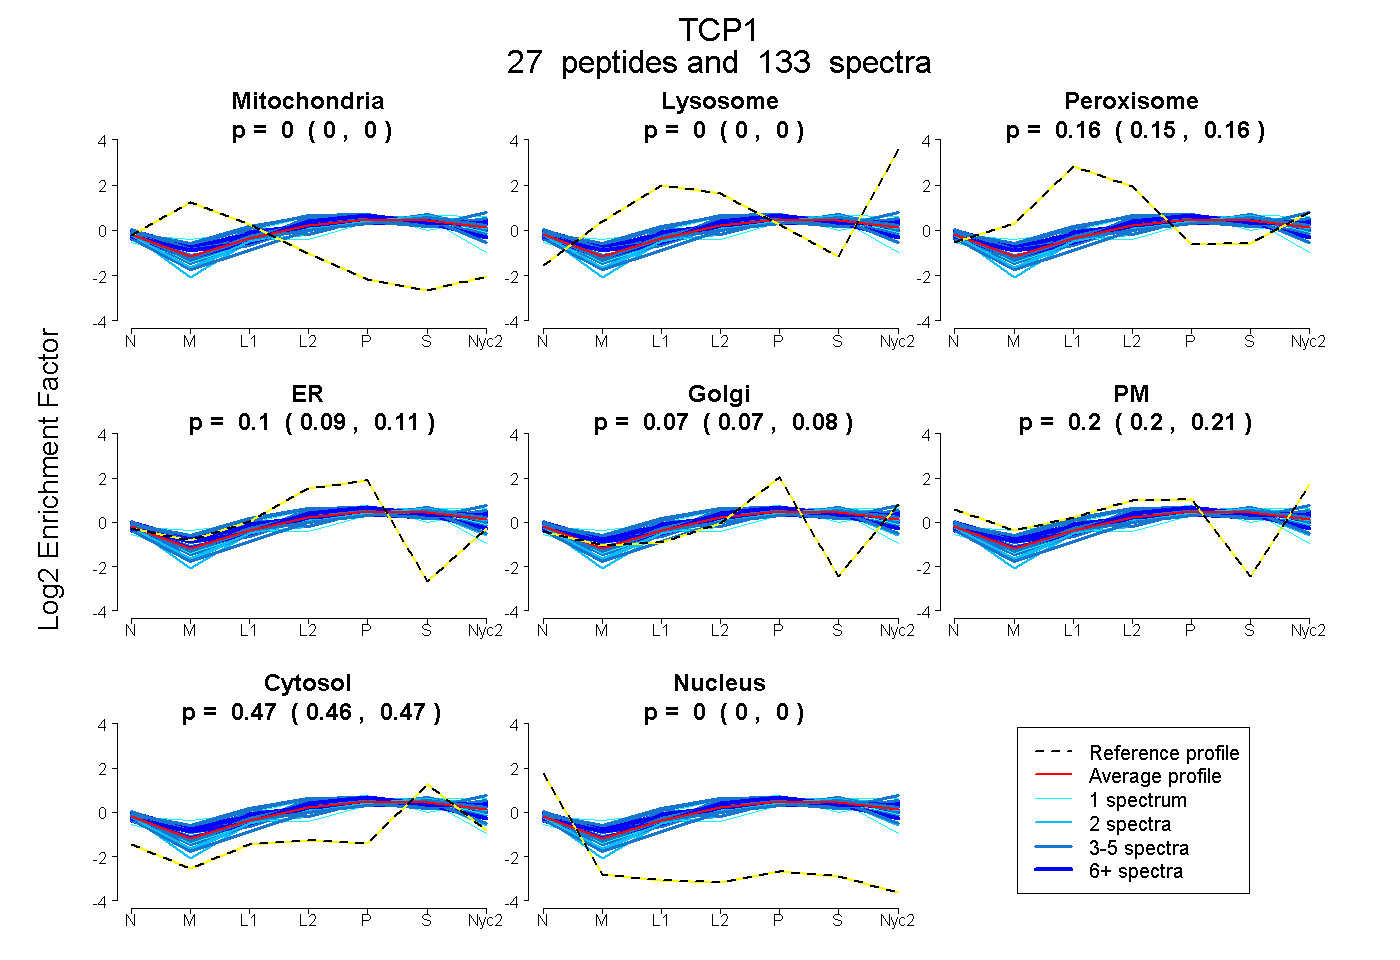
0.000 | 0.000
0.000 | 0.000
0.152 | 0.159
0.094 | 0.106
0.067 | 0.080
0.198 | 0.207
0.464 | 0.468
0.000 | 0.000
18peptides
spectra
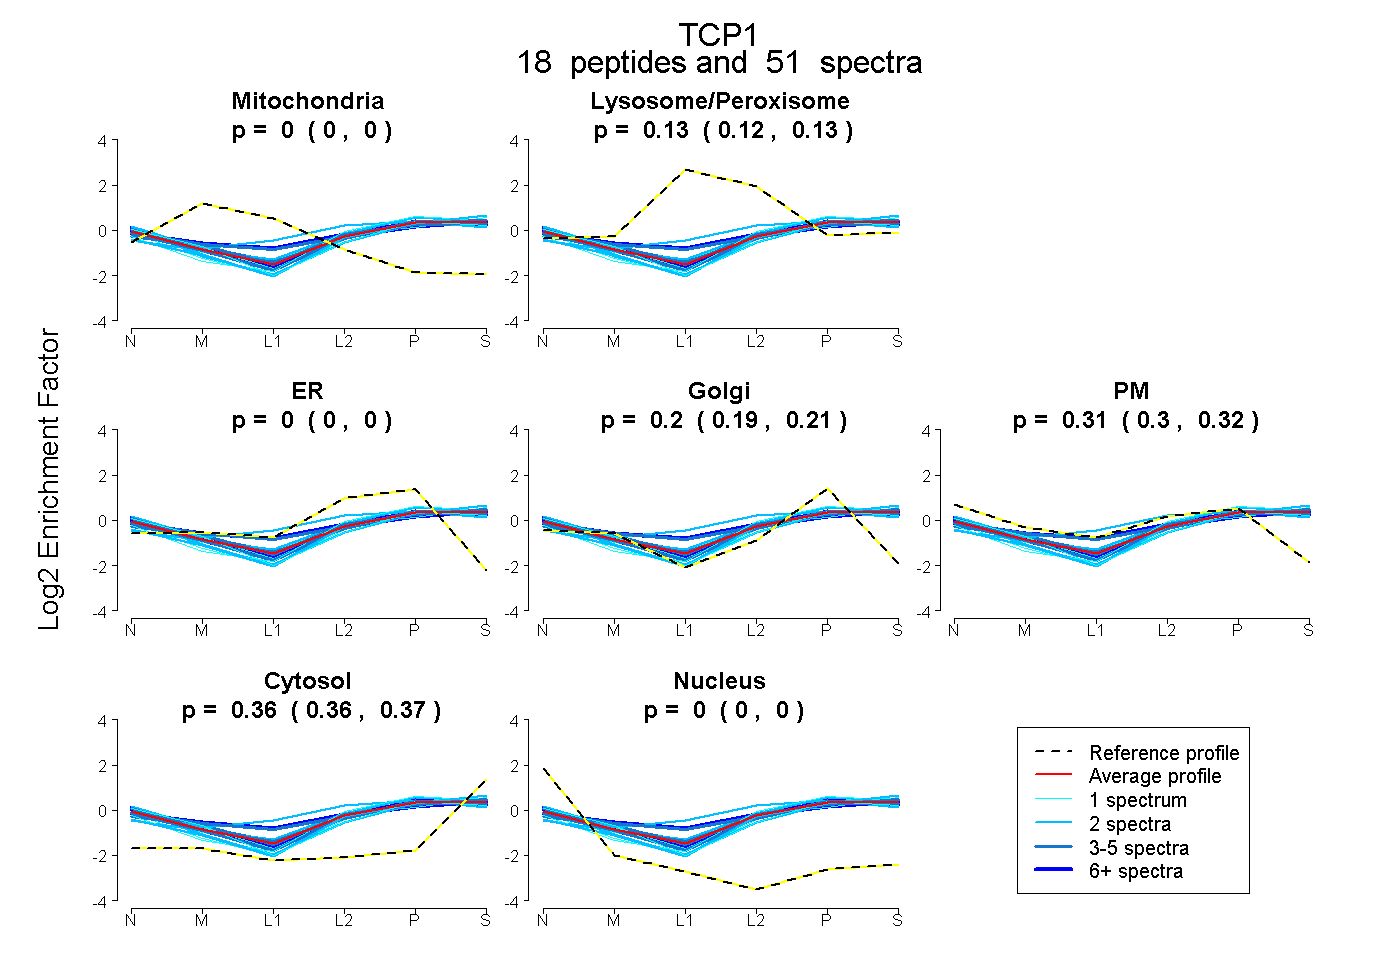
0.000 | 0.000
0.122 | 0.133
0.000 | 0.000
0.193 | 0.205
0.299 | 0.316
0.362 | 0.366
0.000 | 0.000
24peptides
spectra
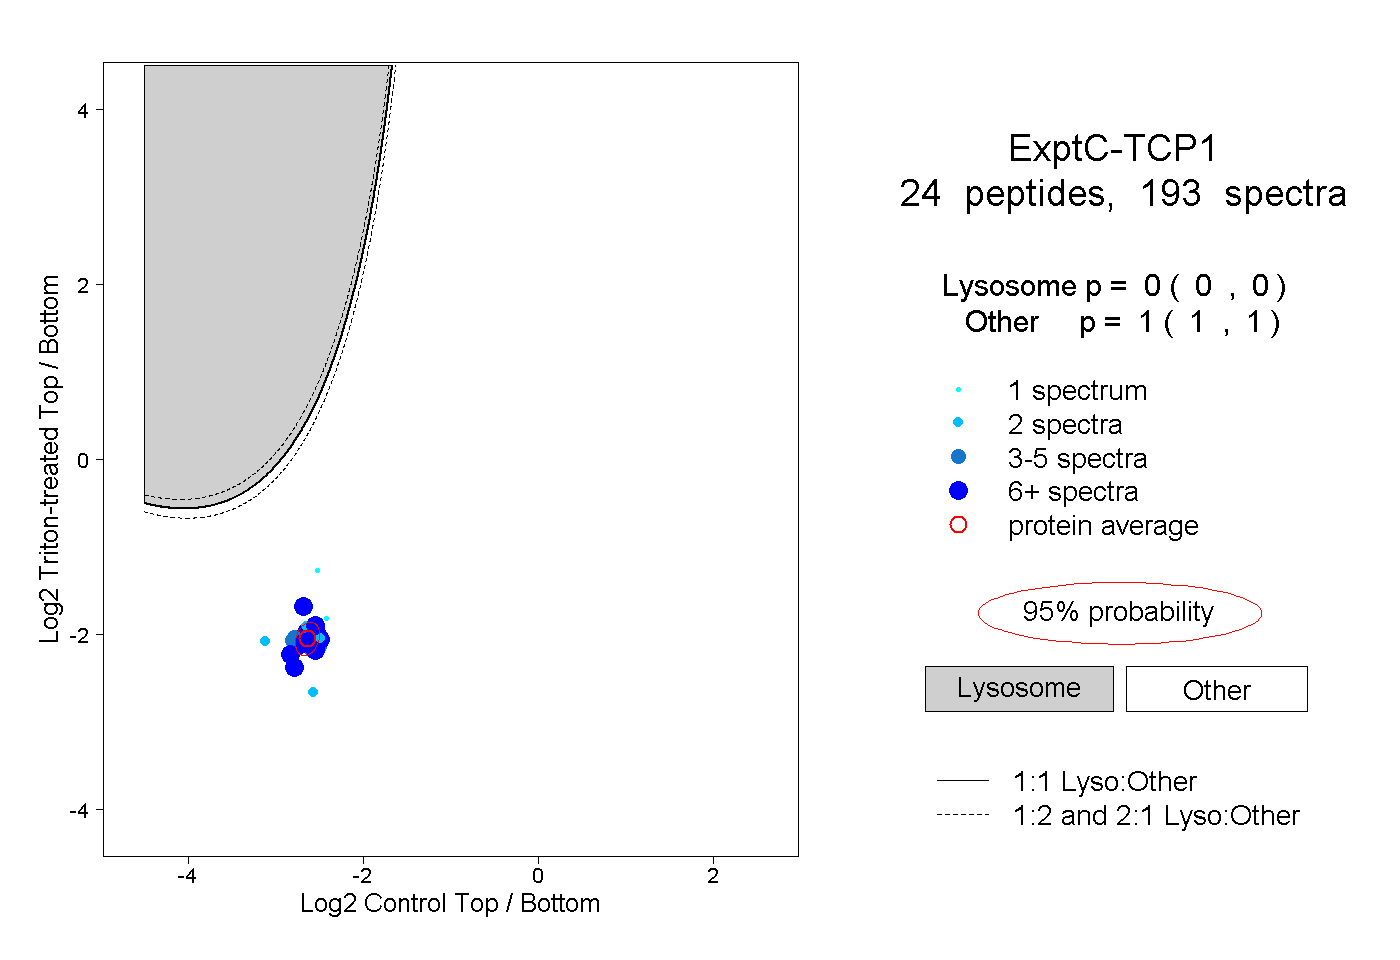
0.000 | 0.000
1.000 | 1.000
12peptides
spectra
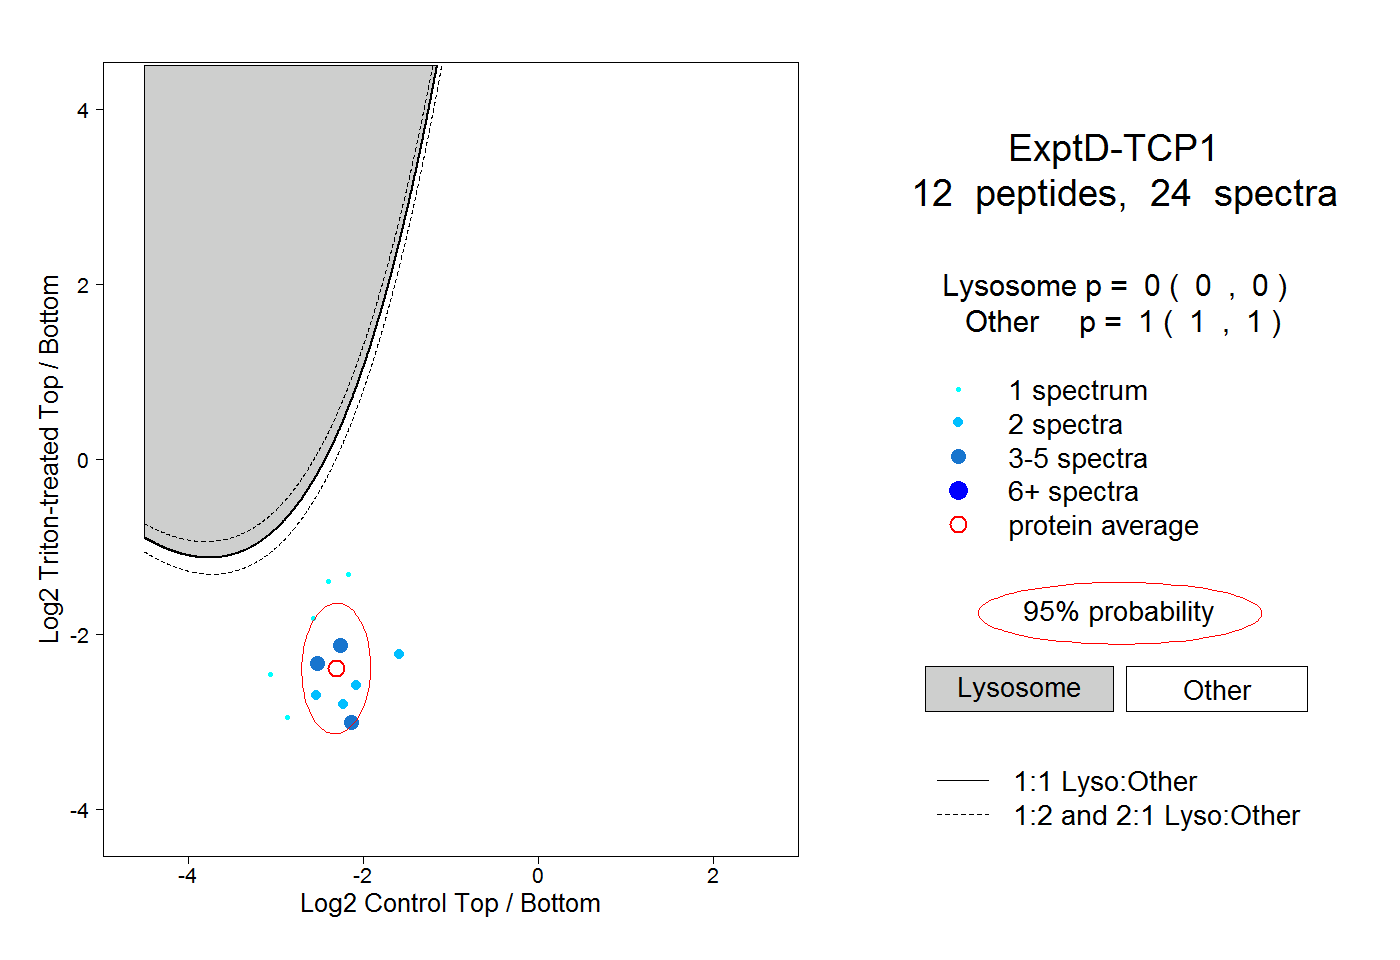
0.000 | 0.000
1.000 | 1.000