 13
13peptides
spectra
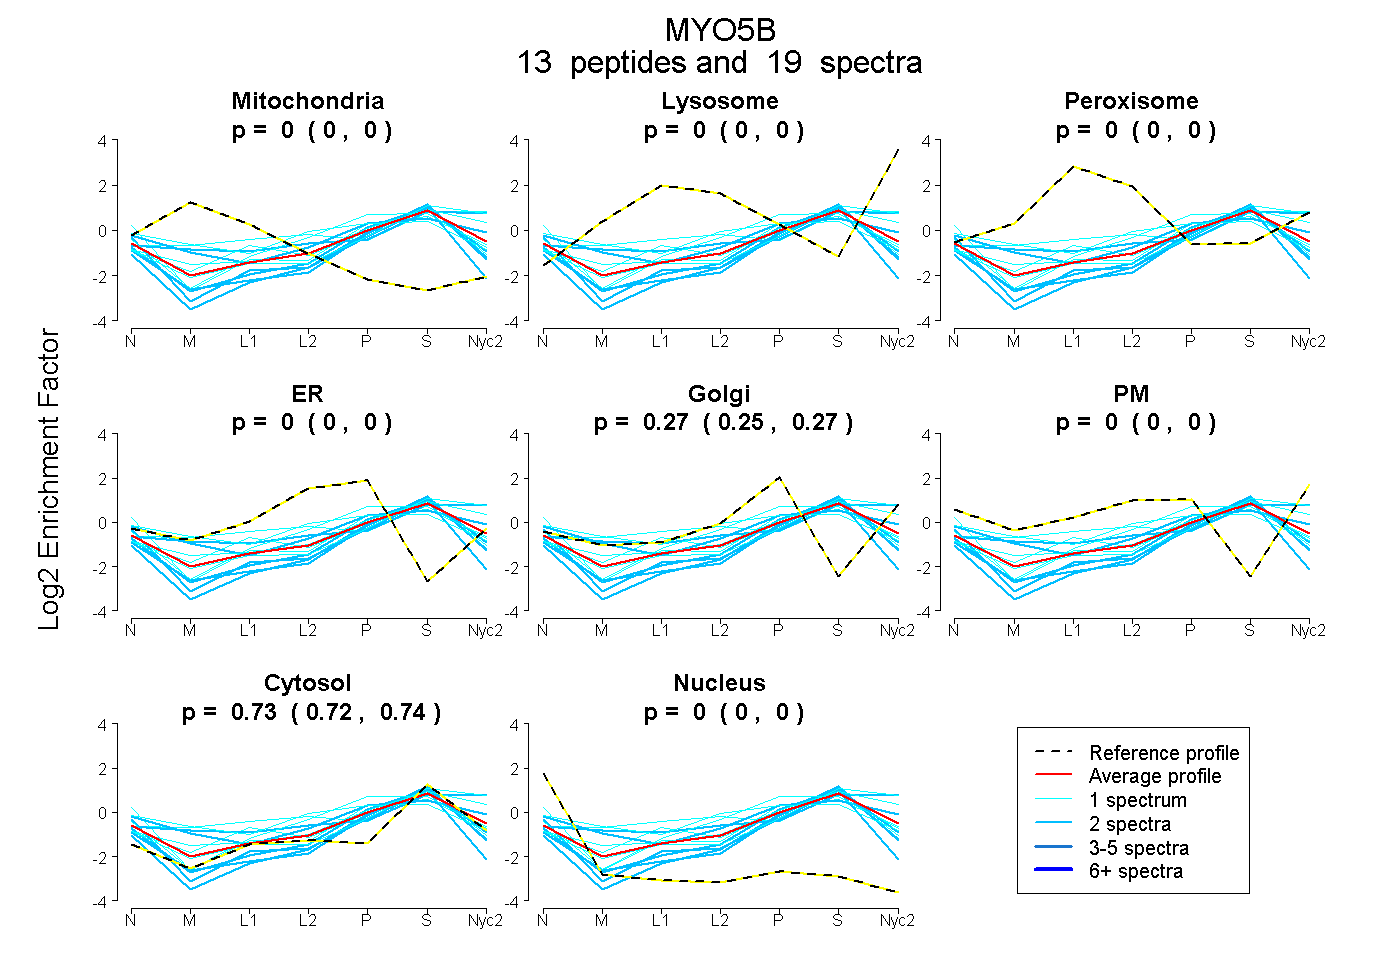
0.000 | 0.000
0.000 | 0.000
0.000 | 0.000
0.000 | 0.000
0.254 | 0.274
0.000 | 0.002
0.725 | 0.743
0.000 | 0.000
3peptides
spectra

0.000 | 0.000
0.000 | 0.112
0.000 | 0.028
0.000 | 0.300
0.070 | 0.533
0.414 | 0.511
0.000 | 0.000
4peptides
spectra

0.000 | 1.000
0.000 | 1.000