 13
13peptides
spectra
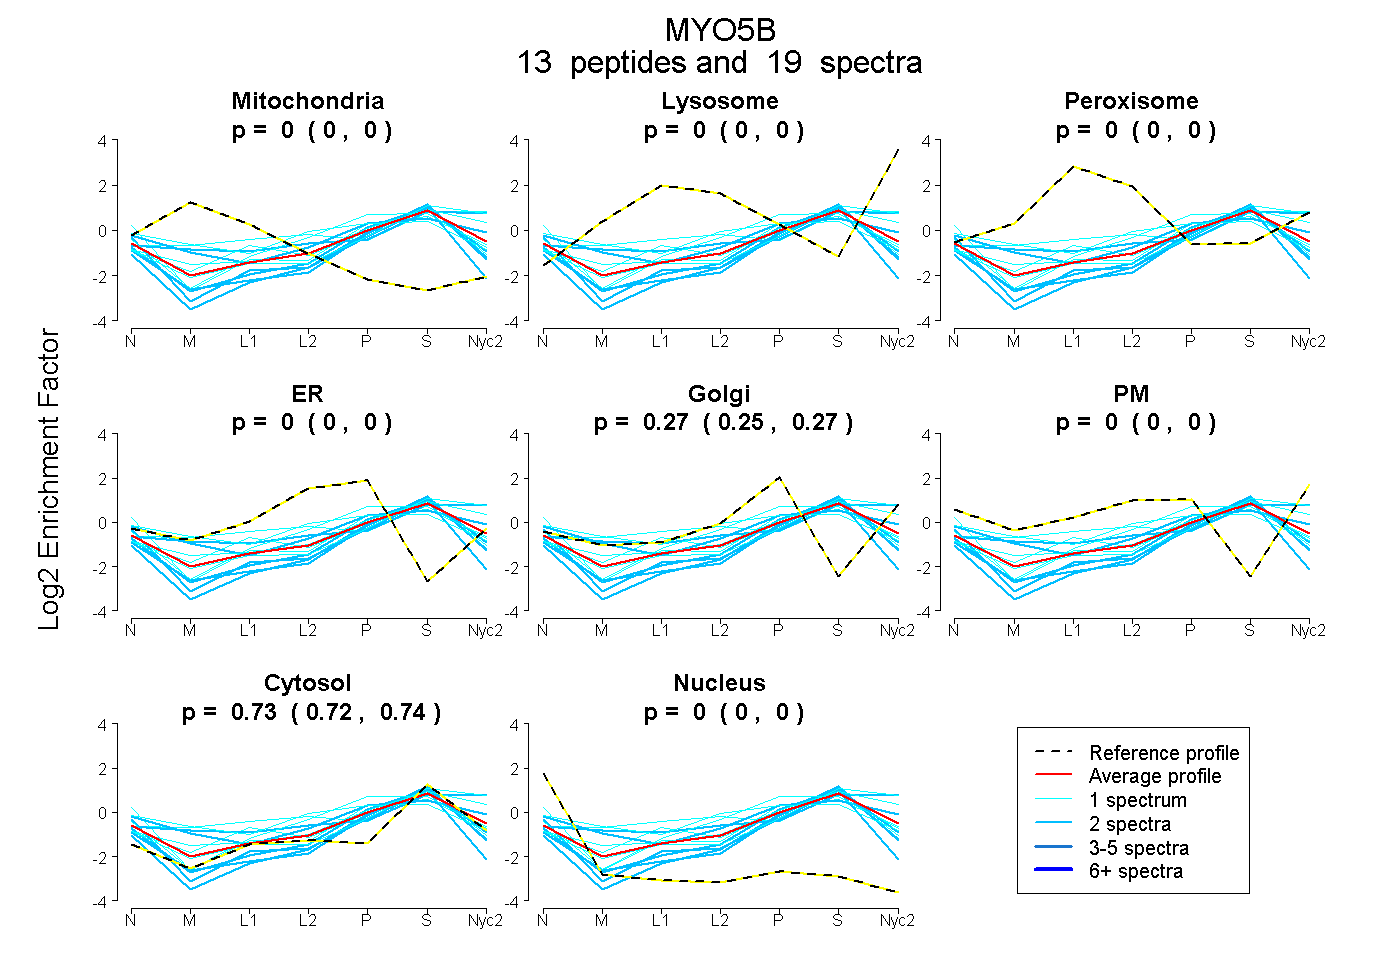
0.000 | 0.000
0.000 | 0.000
0.000 | 0.000
0.000 | 0.000
0.254 | 0.274
0.000 | 0.002
0.725 | 0.743
0.000 | 0.000
| Plot | Mito | Lyso | Perox | ER | Golgi | PM | Cytosol | Nucleus | |||||
| Expt A |
13 peptides |
19 spectra |
|
0.000 0.000 | 0.000 |
0.000 0.000 | 0.000 |
0.000 0.000 | 0.000 |
0.000 0.000 | 0.000 |
0.266 0.254 | 0.274 |
0.000 0.000 | 0.002 |
0.734 0.725 | 0.743 |
0.000 0.000 | 0.000 |
| 1 spectrum, QNEHCLK | 0.064 | 0.000 | 0.032 | 0.317 | 0.000 | 0.062 | 0.525 | 0.000 | ||
| 2 spectra, AATLTLQR | 0.000 | 0.000 | 0.000 | 0.000 | 0.173 | 0.000 | 0.789 | 0.038 | ||
| 2 spectra, HEEEVEHLK | 0.000 | 0.000 | 0.000 | 0.000 | 0.049 | 0.000 | 0.876 | 0.076 | ||
| 2 spectra, LLHCLK | 0.000 | 0.000 | 0.000 | 0.035 | 0.000 | 0.000 | 0.780 | 0.185 | ||
| 2 spectra, LEQEEYMK | 0.000 | 0.189 | 0.000 | 0.000 | 0.000 | 0.181 | 0.630 | 0.000 | ||
| 1 spectrum, NFDLTEYR | 0.000 | 0.081 | 0.000 | 0.000 | 0.166 | 0.000 | 0.753 | 0.000 | ||
| 1 spectrum, QVTVQR | 0.000 | 0.088 | 0.000 | 0.000 | 0.239 | 0.000 | 0.673 | 0.000 | ||
| 1 spectrum, VTVSFIR | 0.000 | 0.000 | 0.000 | 0.246 | 0.092 | 0.000 | 0.662 | 0.000 | ||
| 2 spectra, QALTLLGVR | 0.000 | 0.000 | 0.000 | 0.000 | 0.243 | 0.168 | 0.588 | 0.000 | ||
| 1 spectrum, AAVIIQSYTR | 0.000 | 0.000 | 0.039 | 0.147 | 0.039 | 0.000 | 0.775 | 0.000 | ||
| 1 spectrum, AVQQLR | 0.000 | 0.000 | 0.000 | 0.000 | 0.290 | 0.000 | 0.632 | 0.078 | ||
| 2 spectra, FPLVADLFR | 0.000 | 0.000 | 0.000 | 0.000 | 0.089 | 0.000 | 0.824 | 0.087 | ||
| 1 spectrum, AAMDMTVFLK | 0.000 | 0.249 | 0.058 | 0.000 | 0.000 | 0.128 | 0.566 | 0.000 |
| Plot | Mito | Lyso or Perox | ER | Golgi | PM | Cytosol | Nucleus | ||||||
| Expt B |
3 peptides |
5 spectra |
 |
0.000 0.000 | 0.000 |
0.018 0.000 | 0.112 |
0.000 0.000 | 0.028 |
0.123 0.000 | 0.300 |
0.388 0.070 | 0.533 |
0.470 0.414 | 0.511 |
0.000 0.000 | 0.000 |
|||
| Plot | Lyso | Other | |||||||||||
| Expt C |
4 peptides |
7 spectra |
 |
0.001 0.000 | 1.000 |
0.999 0.000 | 1.000 |