MYO5B
[ENSRNOP00000019512]
Main page
| | | Plot |
Mito |
Lyso |
|
Perox |
ER |
Golgi |
PM |
Cytosol |
Nucleus |
|
| Expt A |
 13
13
peptides |
19
spectra |
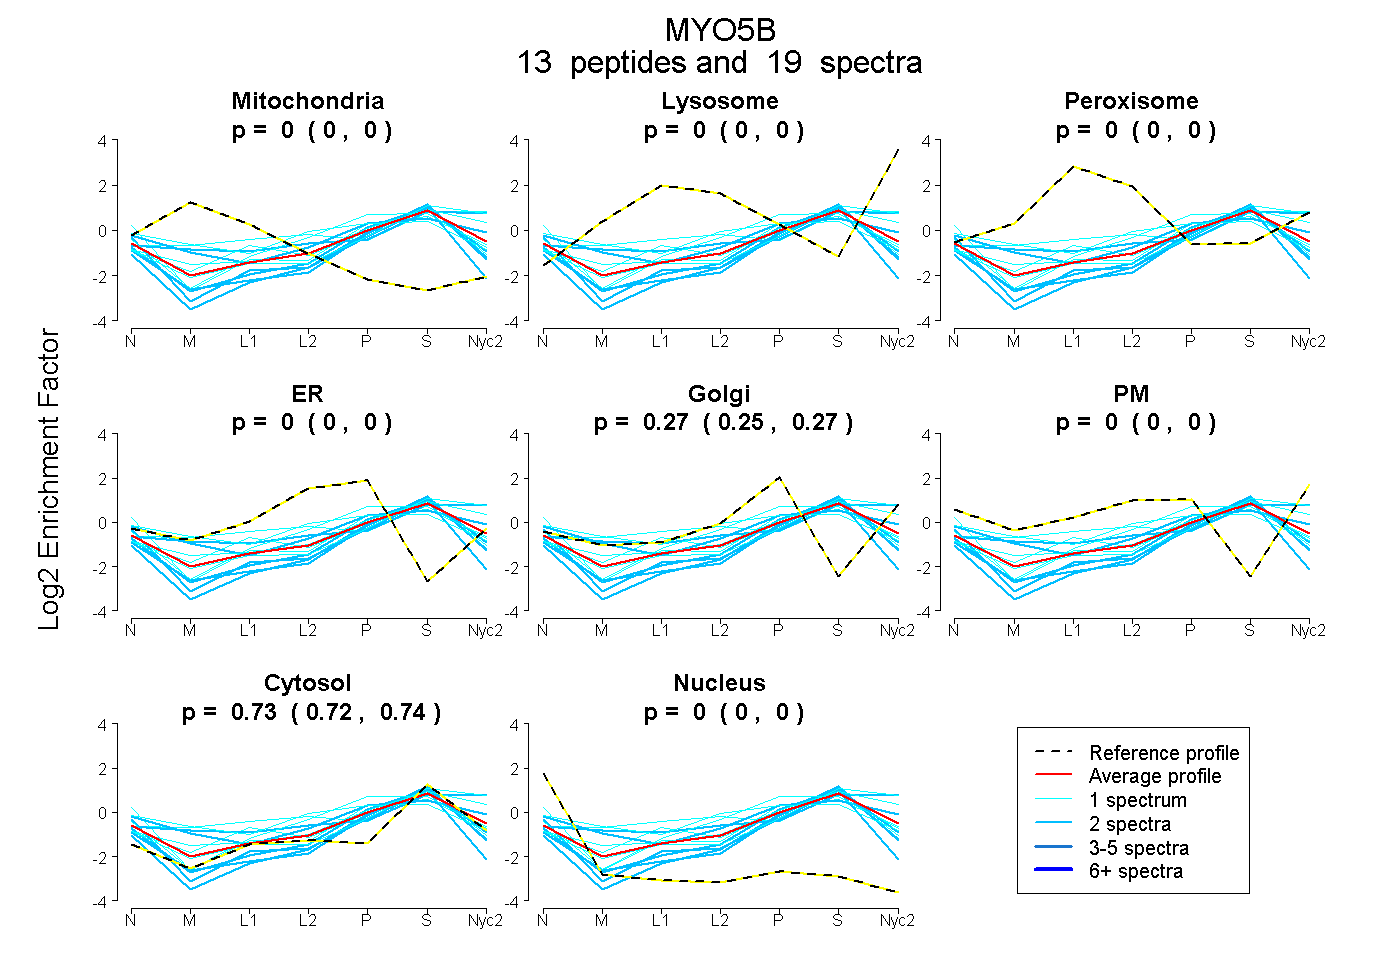 |
0.000
0.000 | 0.000 |
0.000
0.000 | 0.000 |
|
0.000
0.000 | 0.000 |
0.000
0.000 | 0.000 |
0.266
0.254 | 0.274 |
0.000
0.000 | 0.002 |
0.734
0.725 | 0.743 |
0.000
0.000 | 0.000 |
|
| | | Plot |
Mito |
|
Lyso or Perox |
|
ER |
Golgi |
PM |
Cytosol |
Nucleus |
|
| Expt B |
3
peptides |
5
spectra |
 |
0.000
0.000 | 0.000 |
|
0.018
0.000 | 0.112 |
|
0.000
0.000 | 0.028 |
0.123
0.000 | 0.300 |
0.388
0.070 | 0.533 |
0.470
0.414 | 0.511 |
0.000
0.000 | 0.000 |
|
| 1 spectrum, AATLTLQR |
0.000 |
|
0.073 |
|
0.000 |
0.392 |
0.000 |
0.534 |
0.000 |
|
| 2 spectra, QALTLLGVR |
0.000 |
|
0.241 |
|
0.000 |
0.254 |
0.000 |
0.505 |
0.000 |
|
| 2 spectra, AVEQLR |
0.000 |
|
0.000 |
|
0.000 |
0.054 |
0.593 |
0.242 |
0.112 |
|
| | | Plot |
|
Lyso |
|
|
|
|
|
|
|
Other |
| Expt C |
4
peptides |
7
spectra |
 |
|
0.001
0.000 | 1.000 |
|
|
|
|
|
|
|
0.999
0.000 | 1.000 |