 10
10peptides
spectra
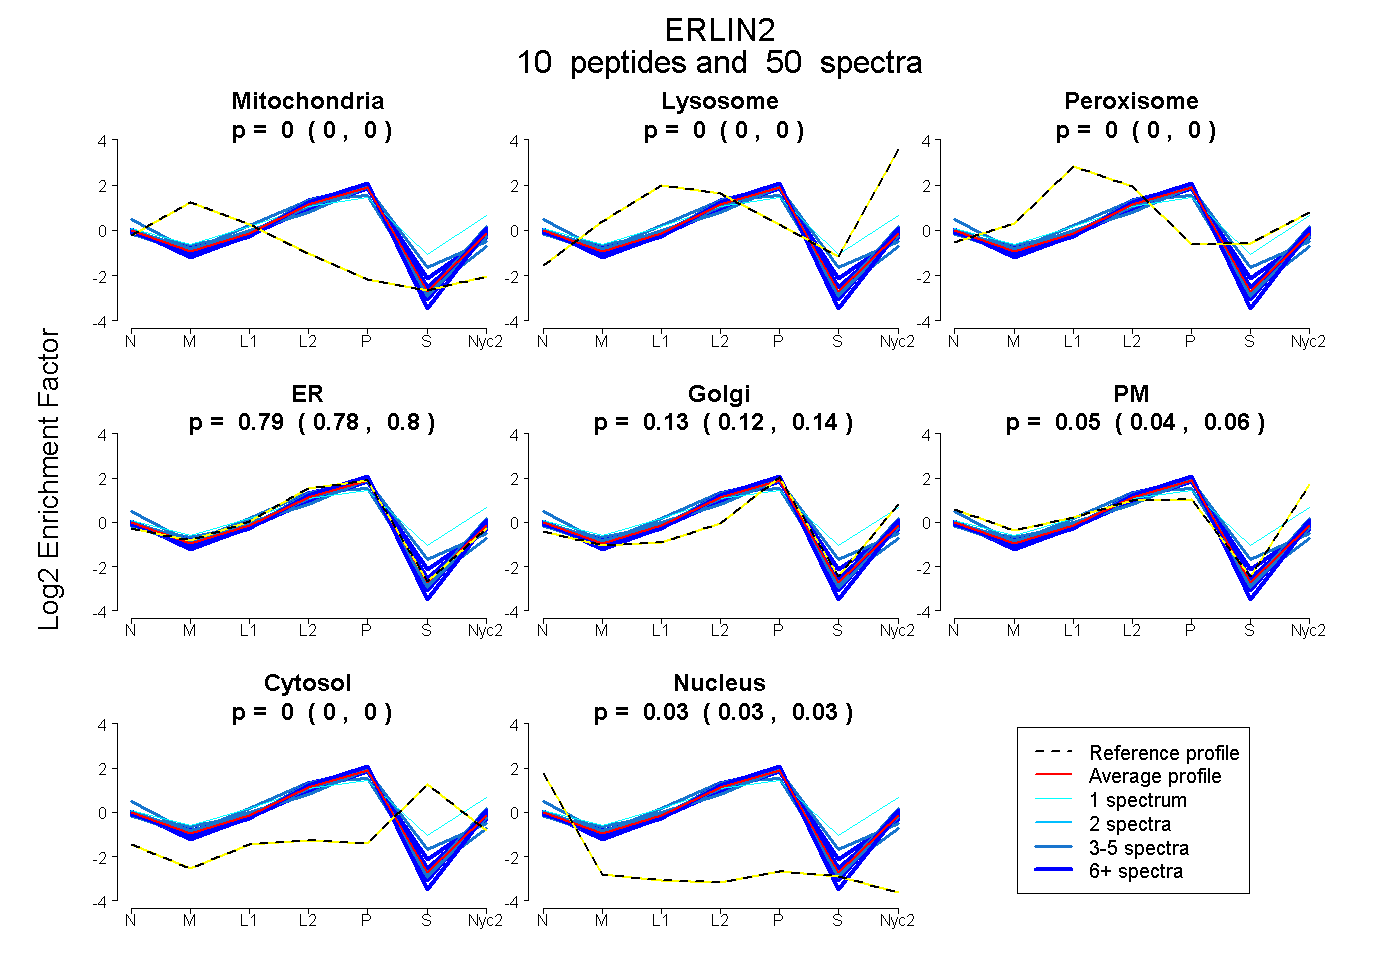
0.000 | 0.000
0.000 | 0.000
0.000 | 0.000
0.777 | 0.797
0.123 | 0.139
0.042 | 0.058
0.000 | 0.000
0.028 | 0.032
3peptides
spectra
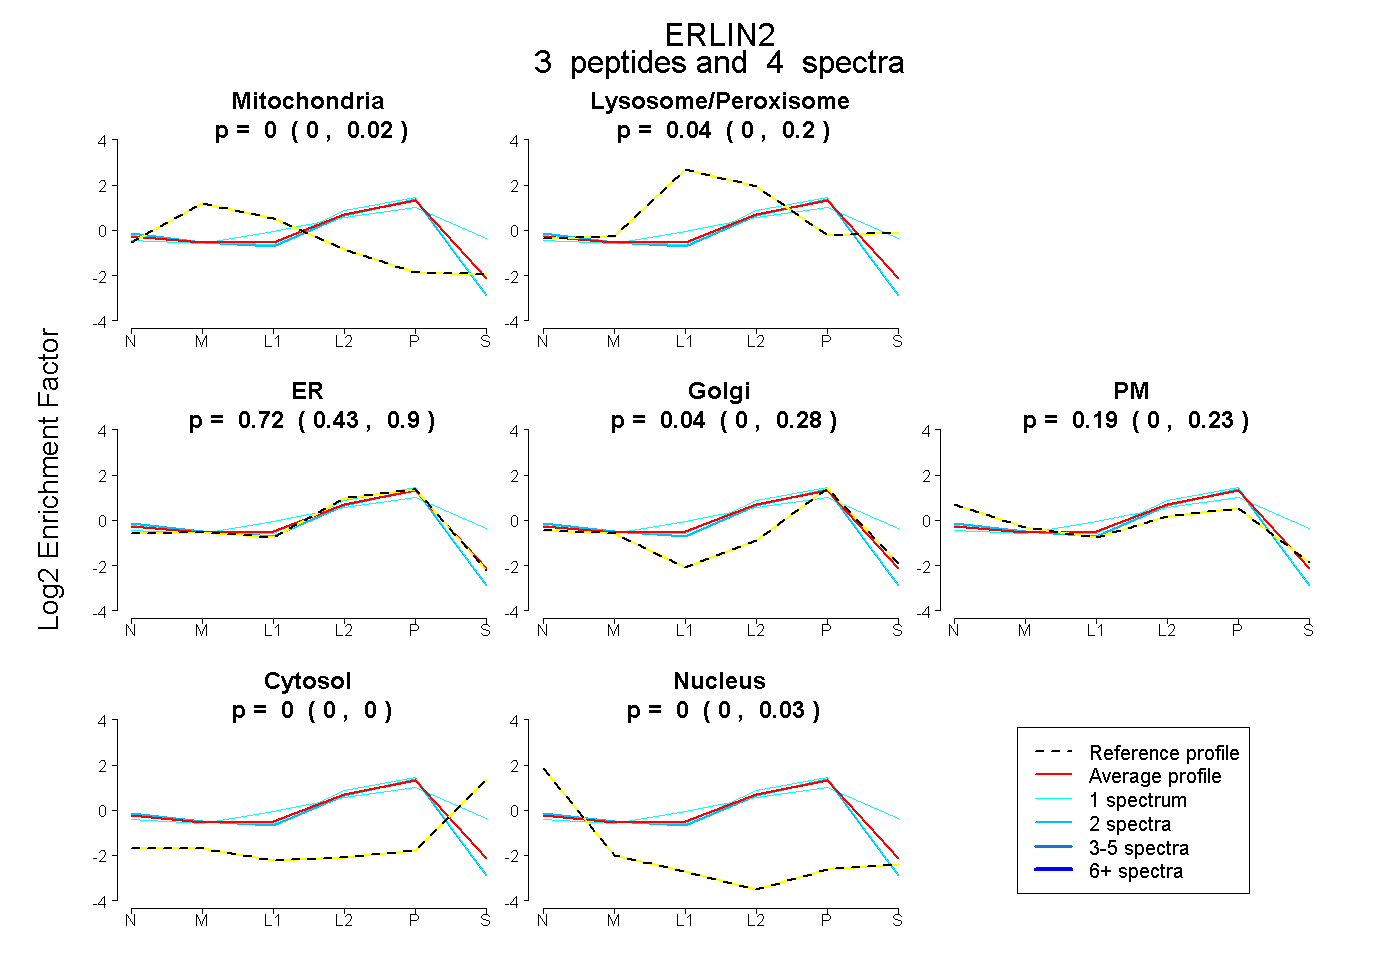
0.000 | 0.025
0.000 | 0.196
0.434 | 0.903
0.000 | 0.278
0.000 | 0.226
0.000 | 0.000
0.000 | 0.034
14peptides
spectra
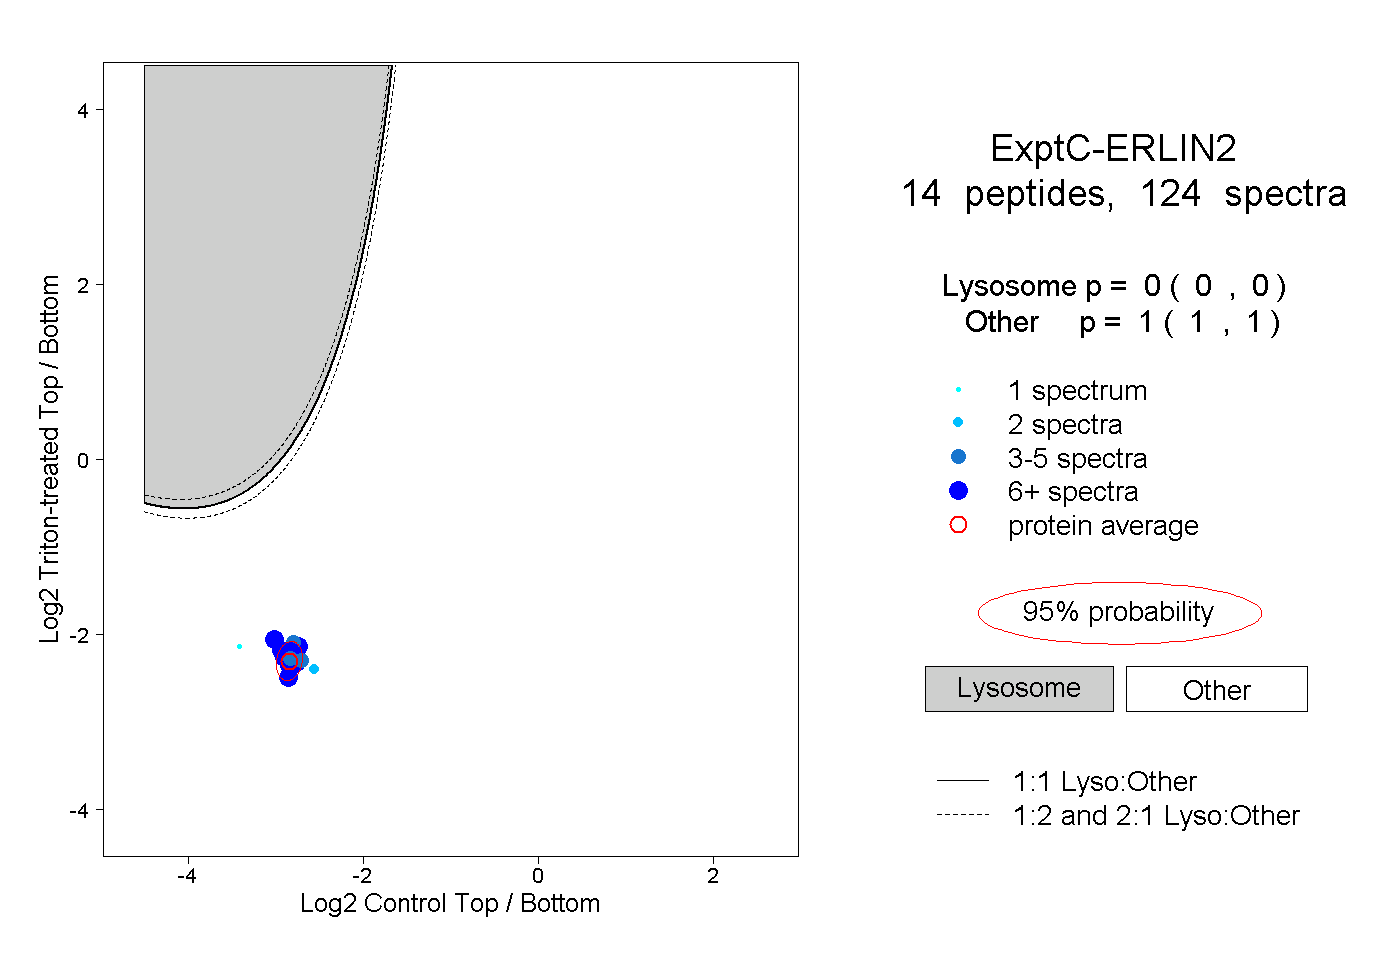
0.000 | 0.000
1.000 | 1.000
4peptides
spectra
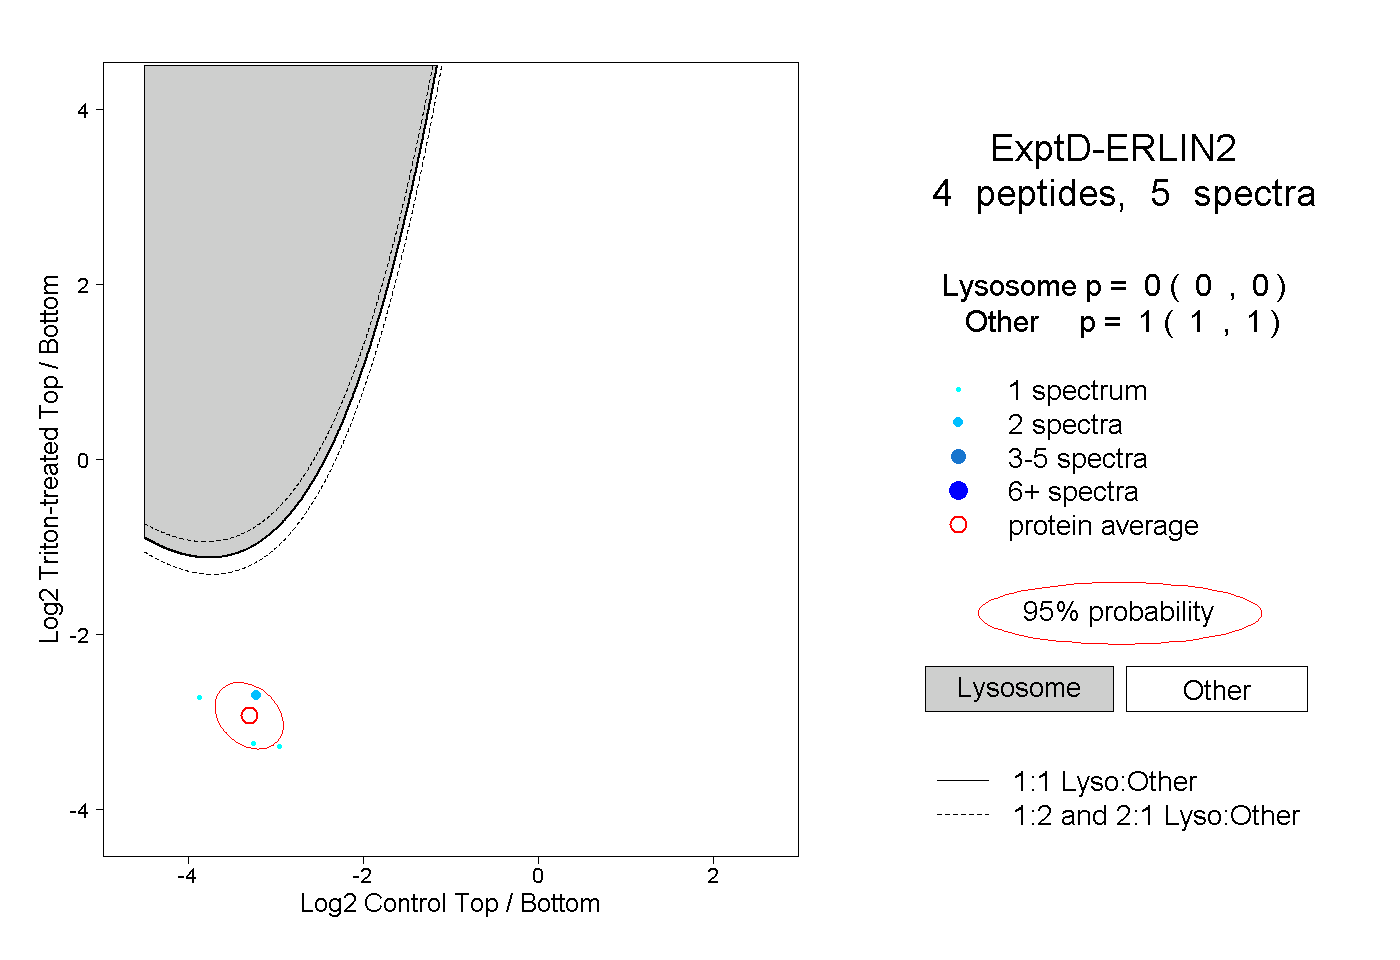
0.000 | 0.000
1.000 | 1.000