 10
10peptides
spectra
0.000 | 0.000
0.000 | 0.000
0.000 | 0.000
0.777 | 0.797
0.123 | 0.139
0.042 | 0.058
0.000 | 0.000
0.028 | 0.032
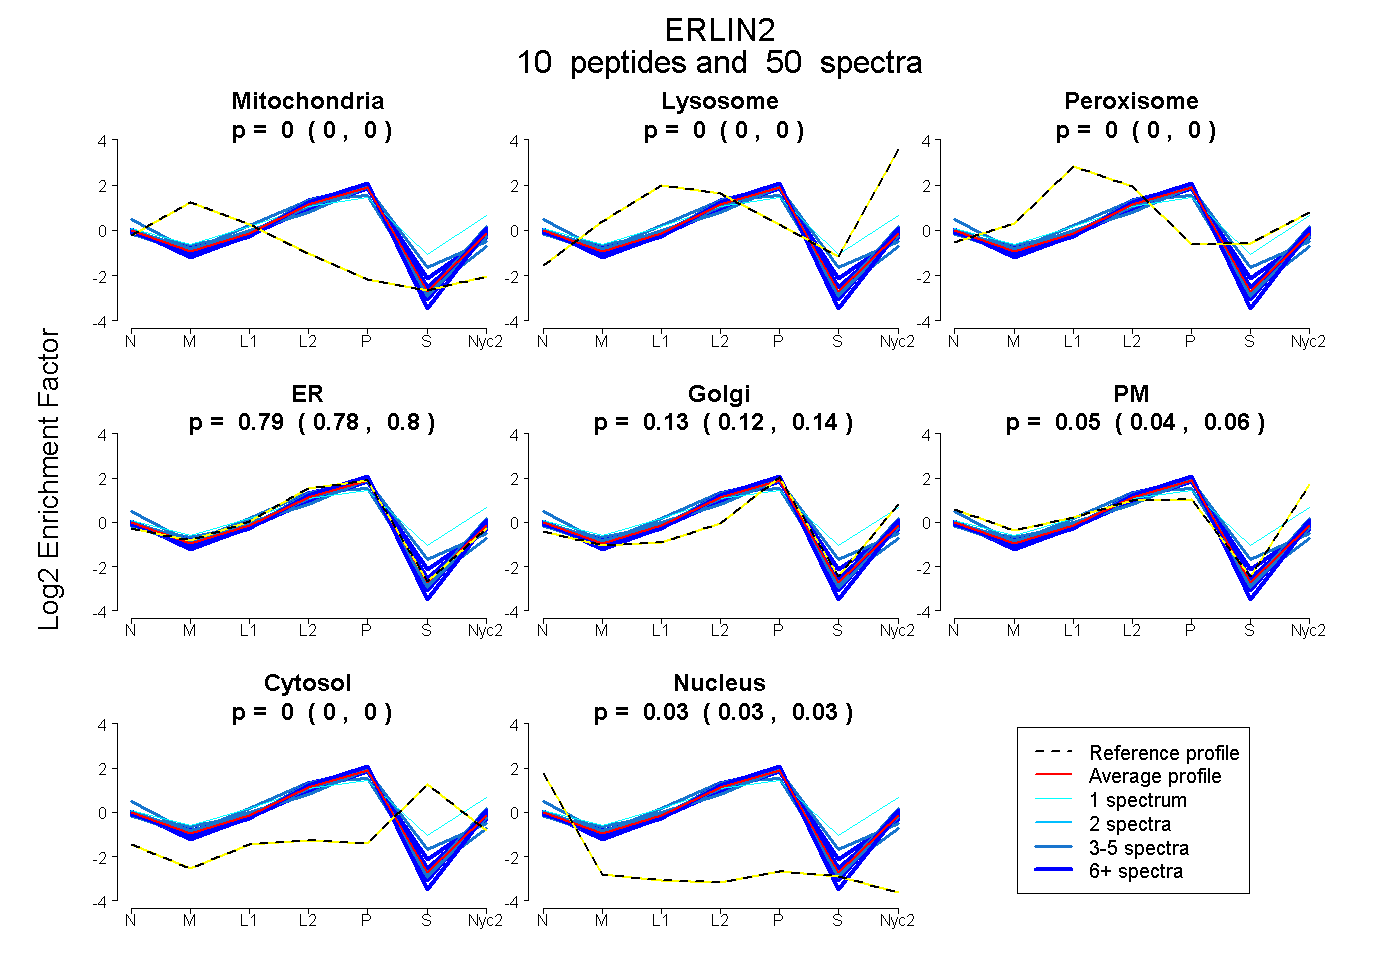
| Plot | Mito | Lyso | Perox | ER | Golgi | PM | Cytosol | Nucleus | |||||
| Expt A |
10 peptides |
50 spectra |
|
0.000 0.000 | 0.000 |
0.000 0.000 | 0.000 |
0.000 0.000 | 0.000 |
0.788 0.777 | 0.797 |
0.131 0.123 | 0.139 |
0.051 0.042 | 0.058 |
0.000 0.000 | 0.000 |
0.030 0.028 | 0.032 |
| 6 spectra, ALIFNK | 0.000 | 0.000 | 0.000 | 0.789 | 0.156 | 0.024 | 0.000 | 0.030 | ||
| 6 spectra, ALIEAEK | 0.000 | 0.000 | 0.000 | 0.750 | 0.156 | 0.000 | 0.063 | 0.031 | ||
| 4 spectra, VAQVAEITYGQK | 0.000 | 0.000 | 0.000 | 0.881 | 0.080 | 0.012 | 0.000 | 0.027 | ||
| 13 spectra, NYELMESEK | 0.000 | 0.000 | 0.000 | 0.759 | 0.160 | 0.078 | 0.000 | 0.003 | ||
| 3 spectra, ADAECYTALK | 0.000 | 0.000 | 0.035 | 0.886 | 0.000 | 0.000 | 0.000 | 0.079 | ||
| 4 spectra, IEEGHIGVYYR | 0.000 | 0.000 | 0.000 | 0.600 | 0.254 | 0.131 | 0.000 | 0.015 | ||
| 1 spectrum, QSEGLSDK | 0.000 | 0.000 | 0.192 | 0.249 | 0.209 | 0.251 | 0.099 | 0.000 | ||
| 3 spectra, LTPEYLQLMK | 0.021 | 0.000 | 0.000 | 0.756 | 0.178 | 0.045 | 0.000 | 0.000 | ||
| 4 spectra, NVPCGTSGGVMIYFDR | 0.000 | 0.000 | 0.000 | 0.845 | 0.011 | 0.000 | 0.144 | 0.000 | ||
| 6 spectra, VTKPNIPEAIR | 0.000 | 0.000 | 0.000 | 0.813 | 0.172 | 0.000 | 0.000 | 0.015 |
| Plot | Mito | Lyso or Perox | ER | Golgi | PM | Cytosol | Nucleus | ||||||
| Expt B |
3 peptides |
4 spectra |
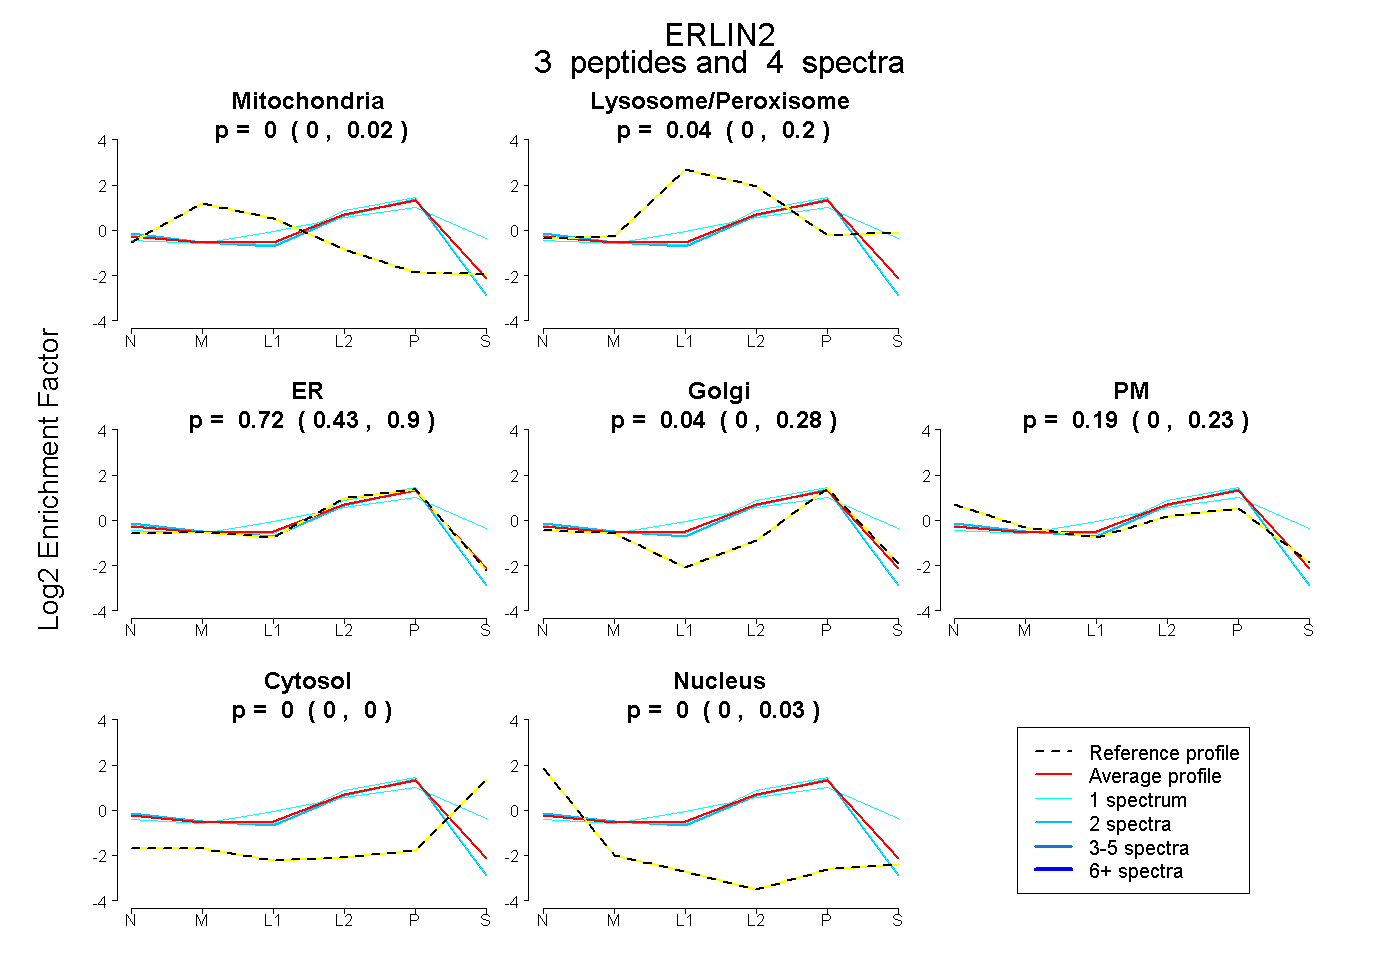 |
0.000 0.000 | 0.025 |
0.044 0.000 | 0.196 |
0.724 0.434 | 0.903 |
0.041 0.000 | 0.278 |
0.191 0.000 | 0.226 |
0.000 0.000 | 0.000 |
0.000 0.000 | 0.034 |
|||
| Plot | Lyso | Other | |||||||||||
| Expt C |
14 peptides |
124 spectra |
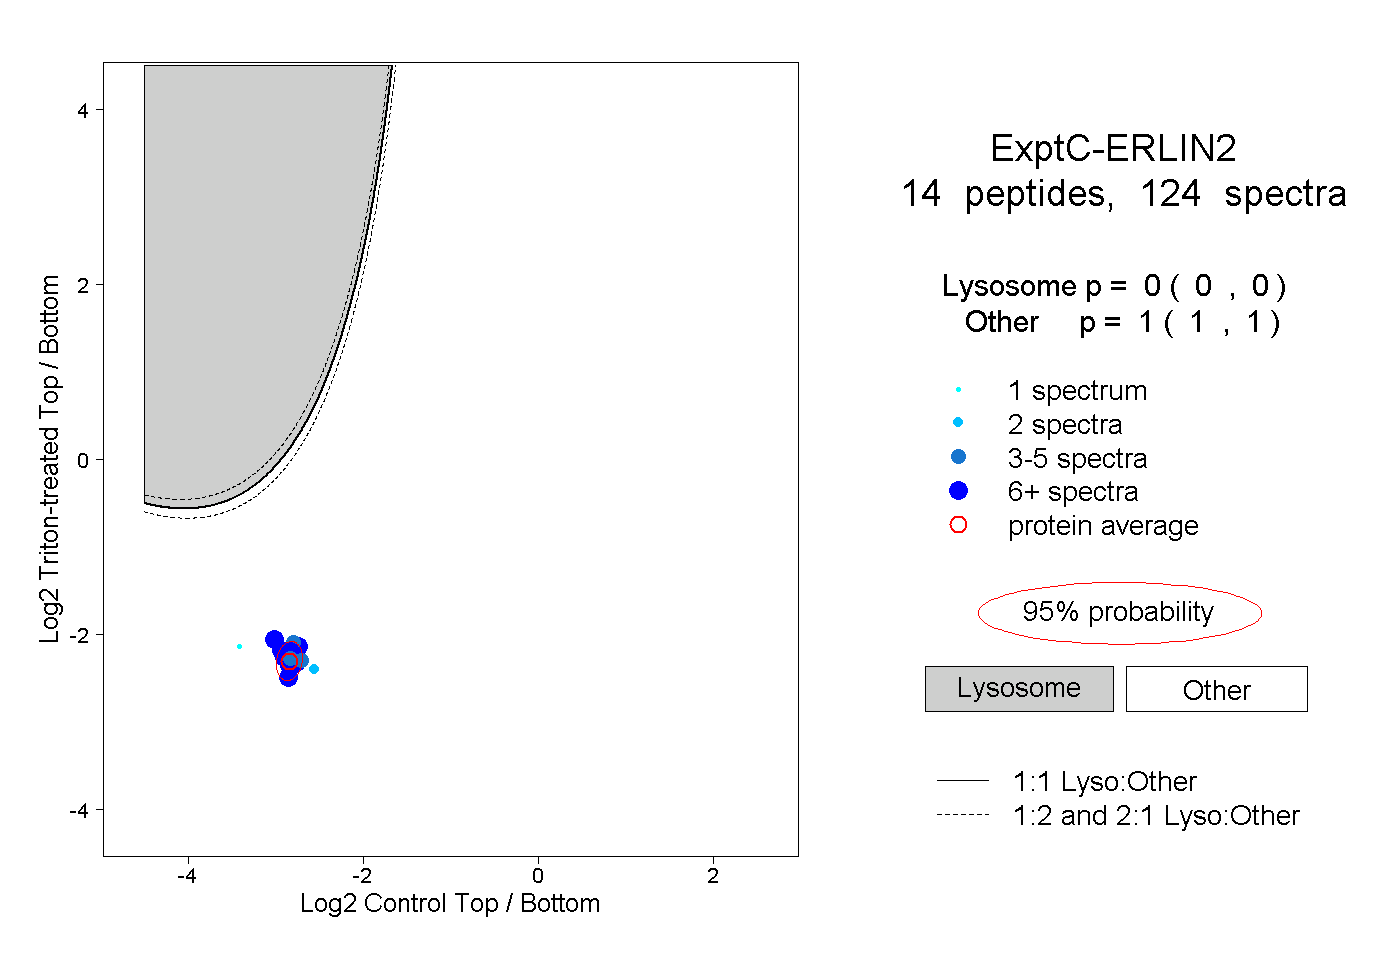 |
0.000 0.000 | 0.000 |
1.000 1.000 | 1.000 |
||||||||
| Plot | Lyso | Other | |||||||||||
| Expt D |
4 peptides |
5 spectra |
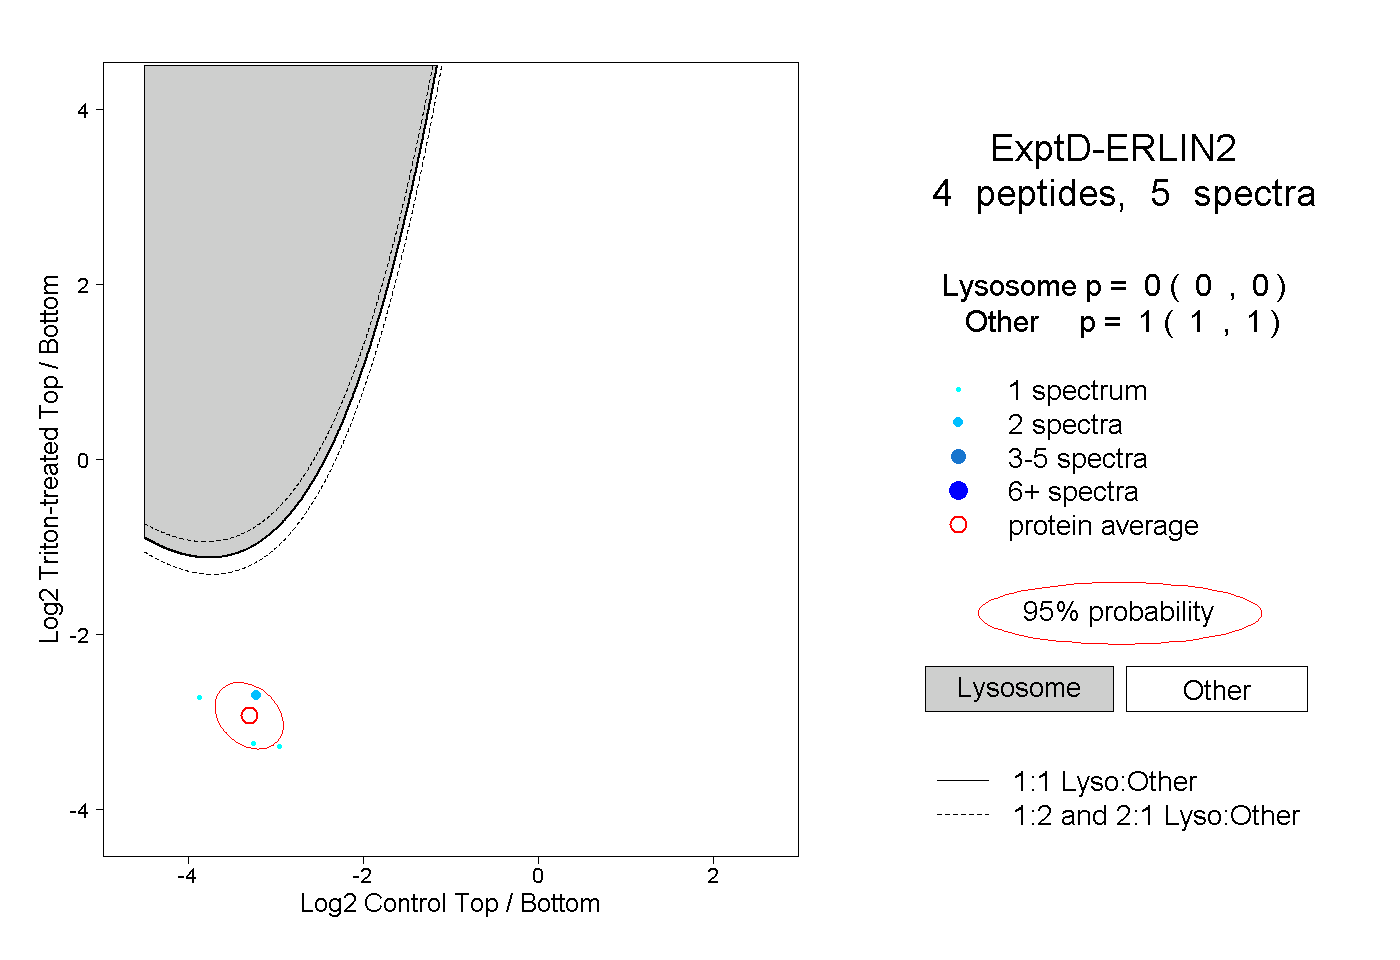 |
0.000 0.000 | 0.000 |
1.000 1.000 | 1.000 |