ERLIN2
[ENSRNOP00000018973]
Main page
| | | Plot |
Mito |
Lyso |
|
Perox |
ER |
Golgi |
PM |
Cytosol |
Nucleus |
|
| Expt A |
 10
10
peptides |
50
spectra |
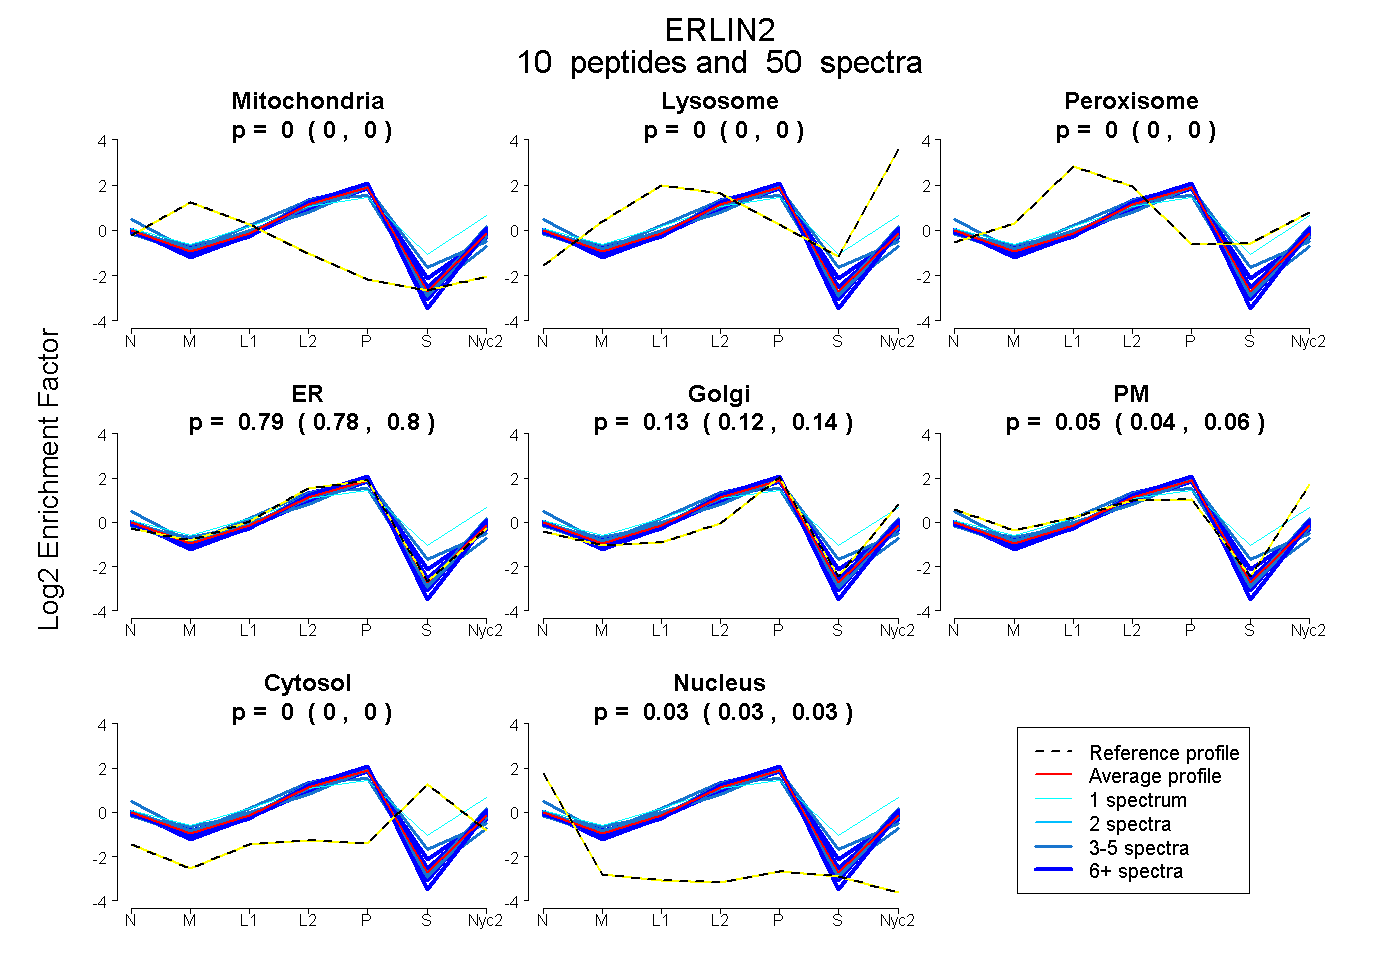 |
0.000
0.000 | 0.000 |
0.000
0.000 | 0.000 |
|
0.000
0.000 | 0.000 |
0.788
0.777 | 0.797 |
0.131
0.123 | 0.139 |
0.051
0.042 | 0.058 |
0.000
0.000 | 0.000 |
0.030
0.028 | 0.032 |
|
| | | Plot |
Mito |
|
Lyso or Perox |
|
ER |
Golgi |
PM |
Cytosol |
Nucleus |
|
| Expt B |
3
peptides |
4
spectra |
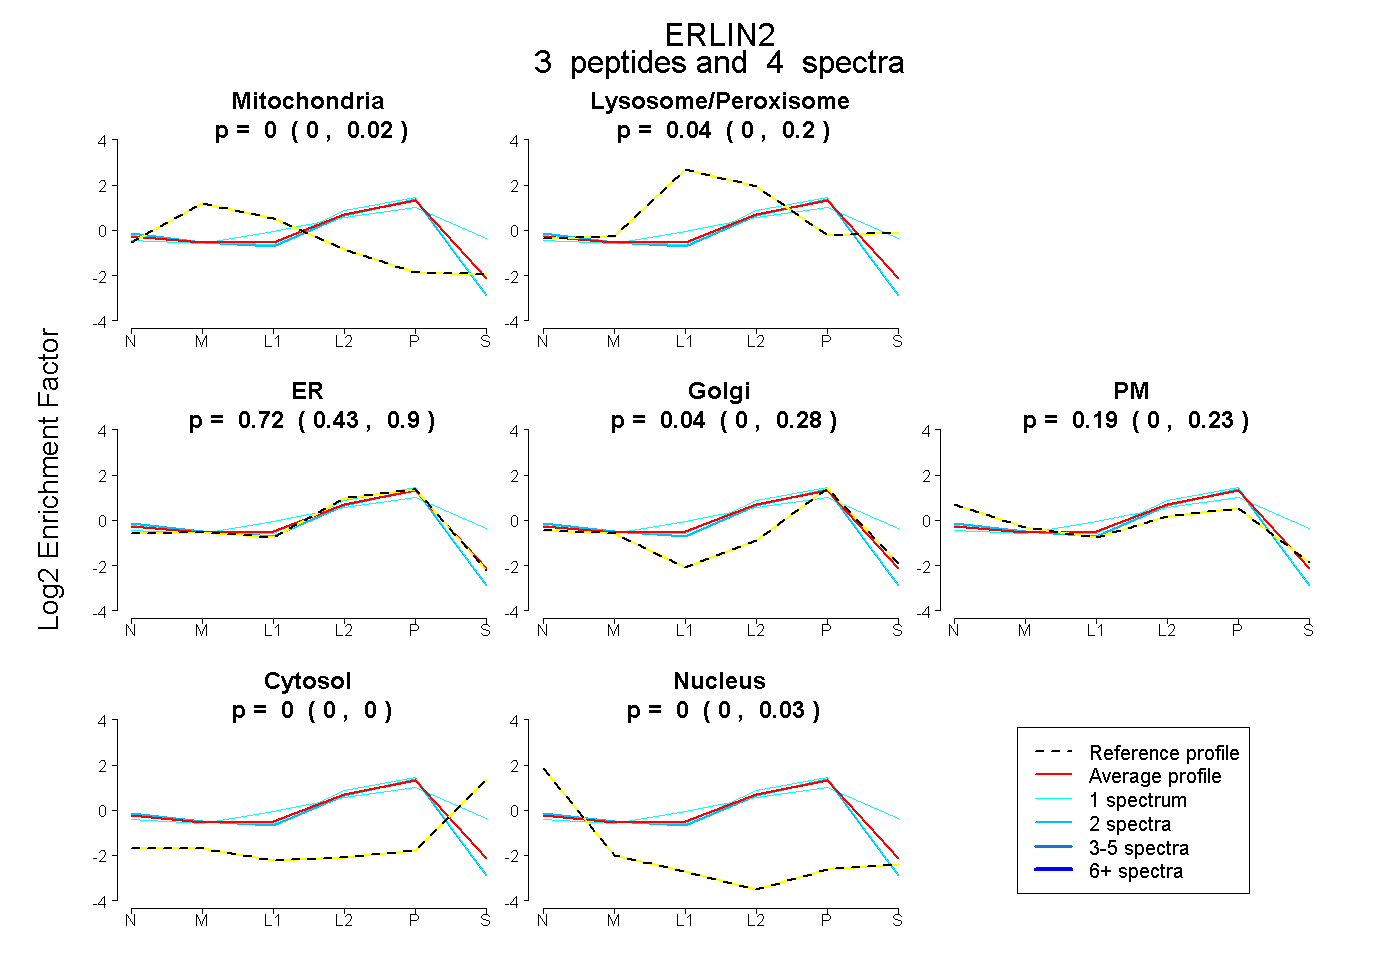 |
0.000
0.000 | 0.025 |
|
0.044
0.000 | 0.196 |
|
0.724
0.434 | 0.903 |
0.041
0.000 | 0.278 |
0.191
0.000 | 0.226 |
0.000
0.000 | 0.000 |
0.000
0.000 | 0.034 |
|
| 1 spectrum, ALIFNK |
0.000 |
|
0.000 |
|
0.929 |
0.000 |
0.068 |
0.000 |
0.003 |
|
| 2 spectra, ALIEAEK |
0.000 |
|
0.000 |
|
0.866 |
0.000 |
0.100 |
0.000 |
0.034 |
|
| 1 spectrum, VTKPNIPEAIR |
0.000 |
|
0.455 |
|
0.005 |
0.491 |
0.000 |
0.049 |
0.000 |
|
| | | Plot |
|
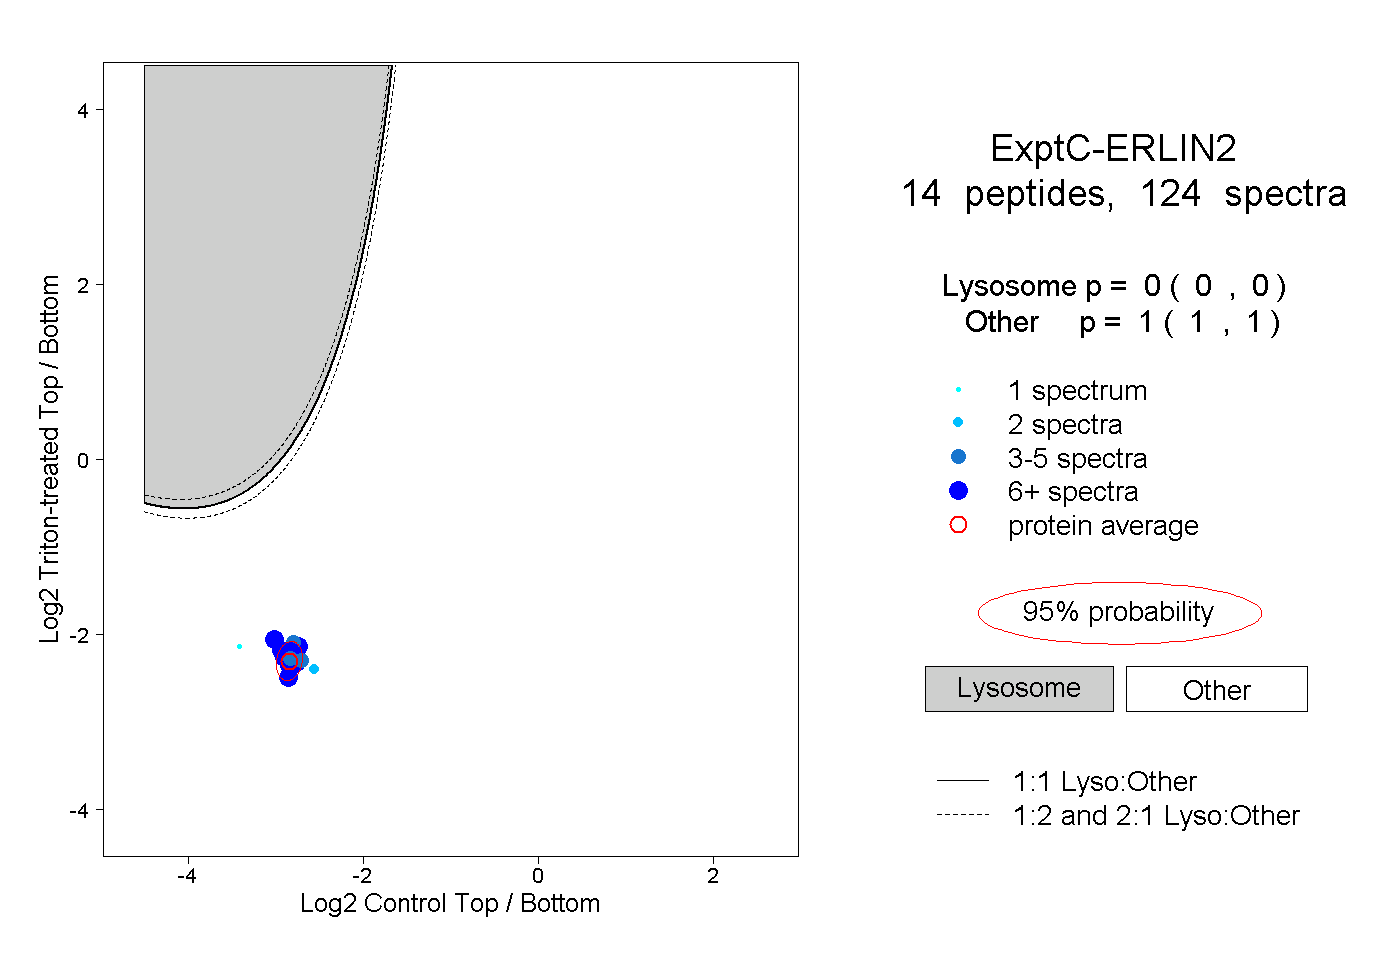
Lyso |
|
|
|
|
|
|
|
Other |
| Expt C |
14
peptides |
124
spectra |
 |
|
0.000
0.000 | 0.000 |
|
|
|
|
|
|
|
1.000
1.000 | 1.000 |
| | | Plot |
|
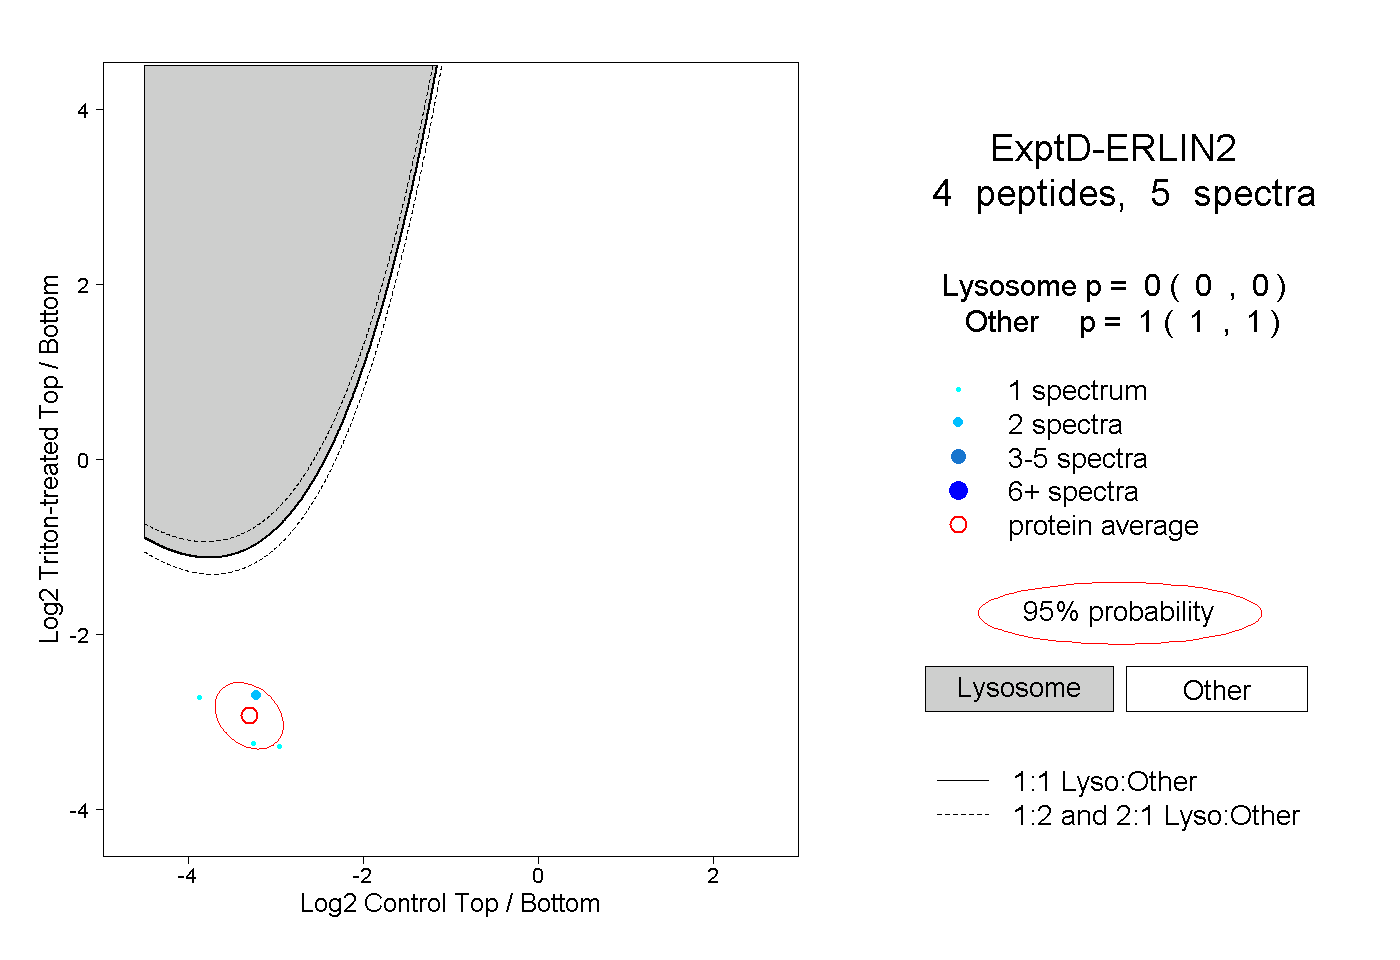
Lyso |
|
|
|
|
|
|
|
Other |
| Expt D |
4
peptides |
5
spectra |
 |
|
0.000
0.000 | 0.000 |
|
|
|
|
|
|
|
1.000
1.000 | 1.000 |