 7
7peptides
spectra
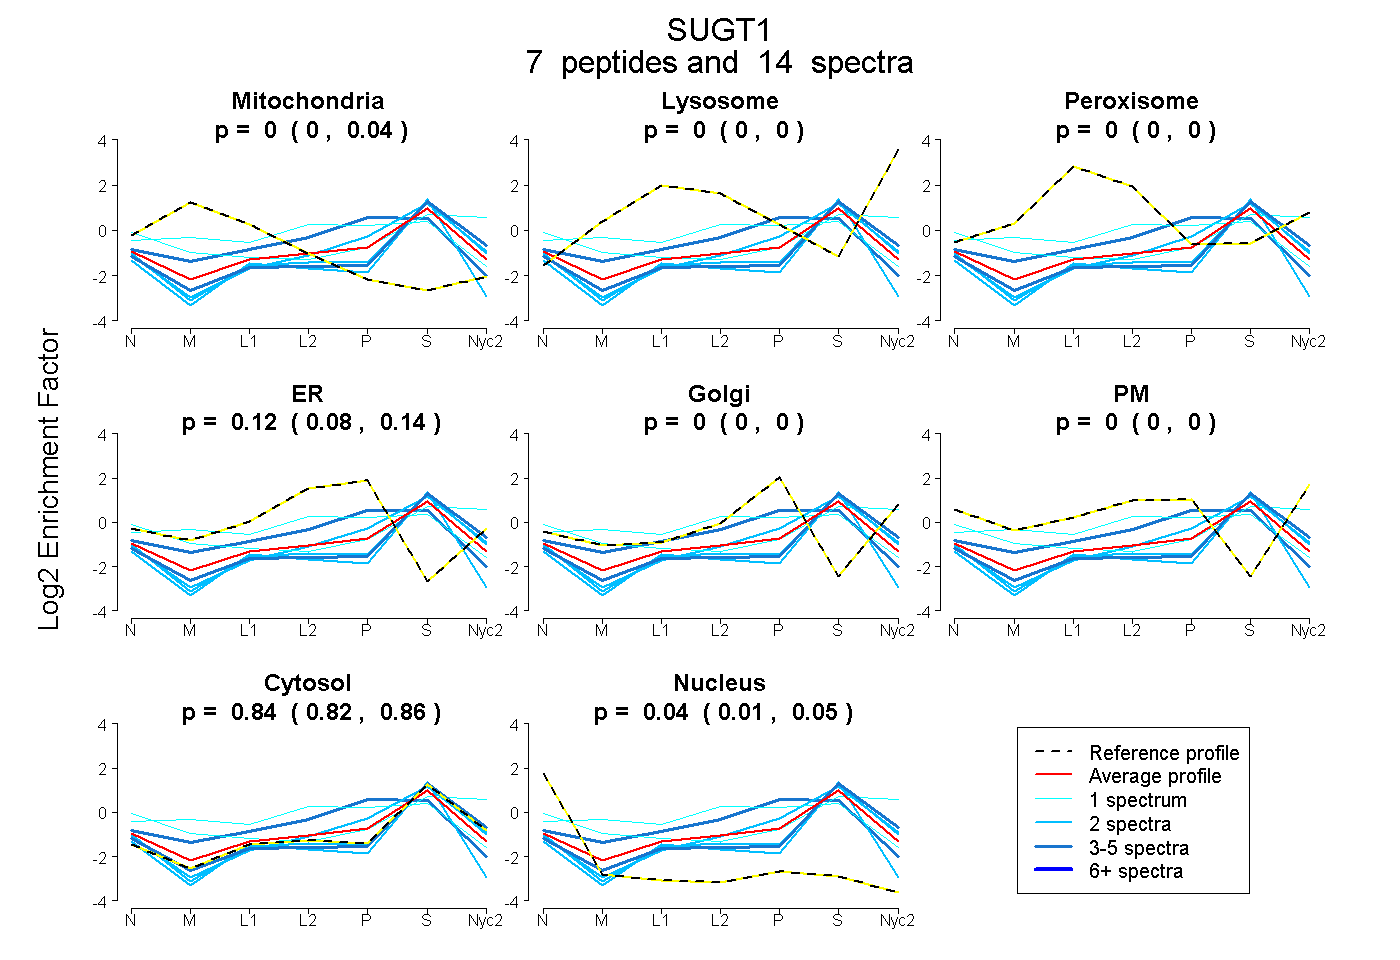
0.000 | 0.039
0.000 | 0.000
0.000 | 0.000
0.084 | 0.137
0.000 | 0.000
0.000 | 0.000
0.817 | 0.859
0.013 | 0.053
2peptides
spectra
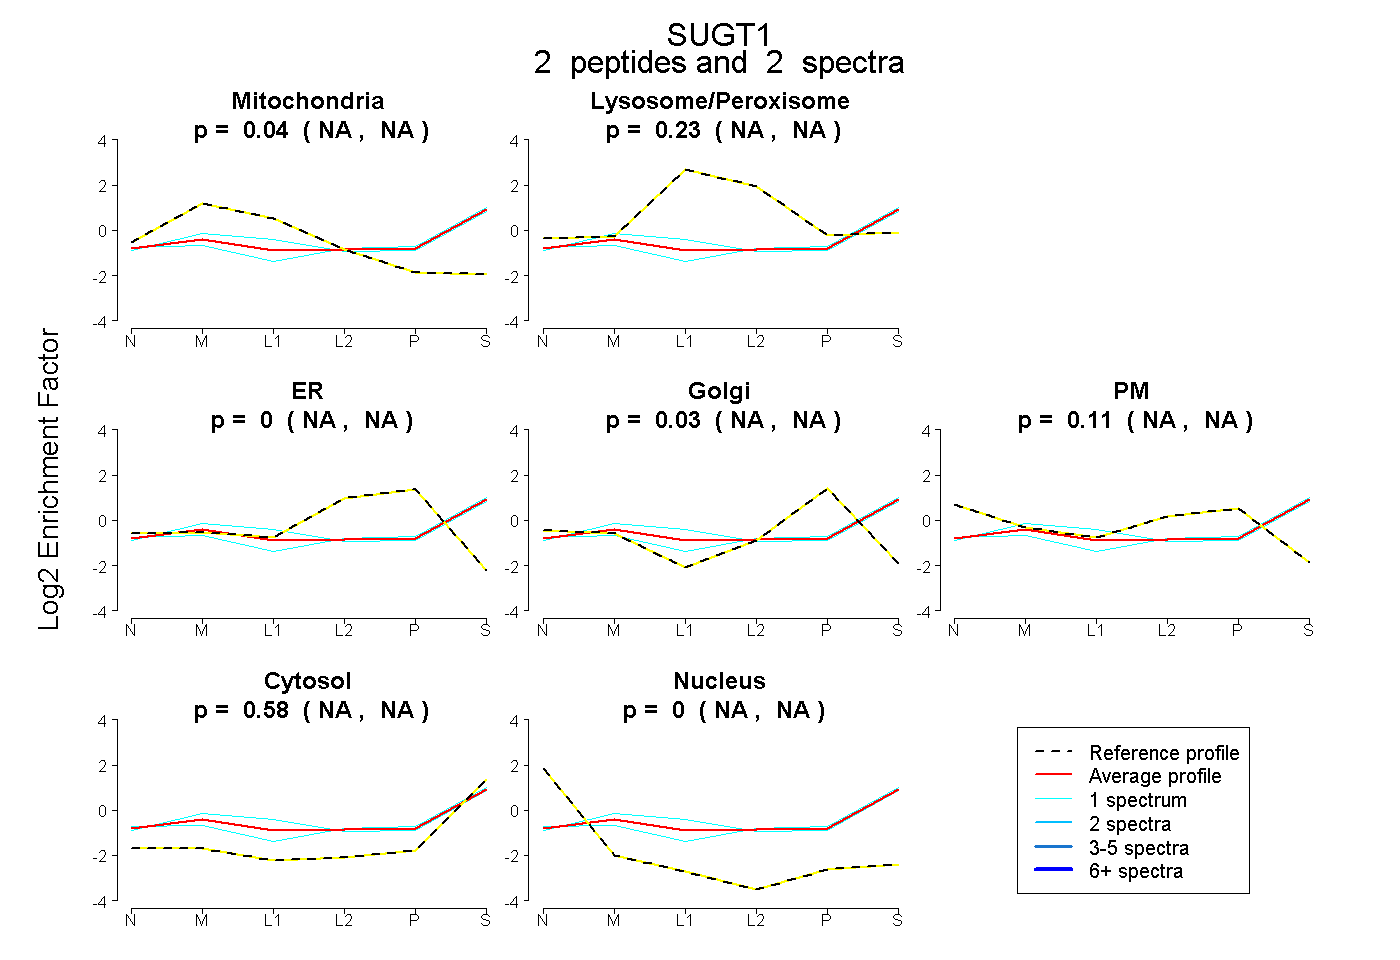
NA | NA
NA | NA
NA | NA
NA | NA
NA | NA
NA | NA
NA | NA
6peptides
spectra
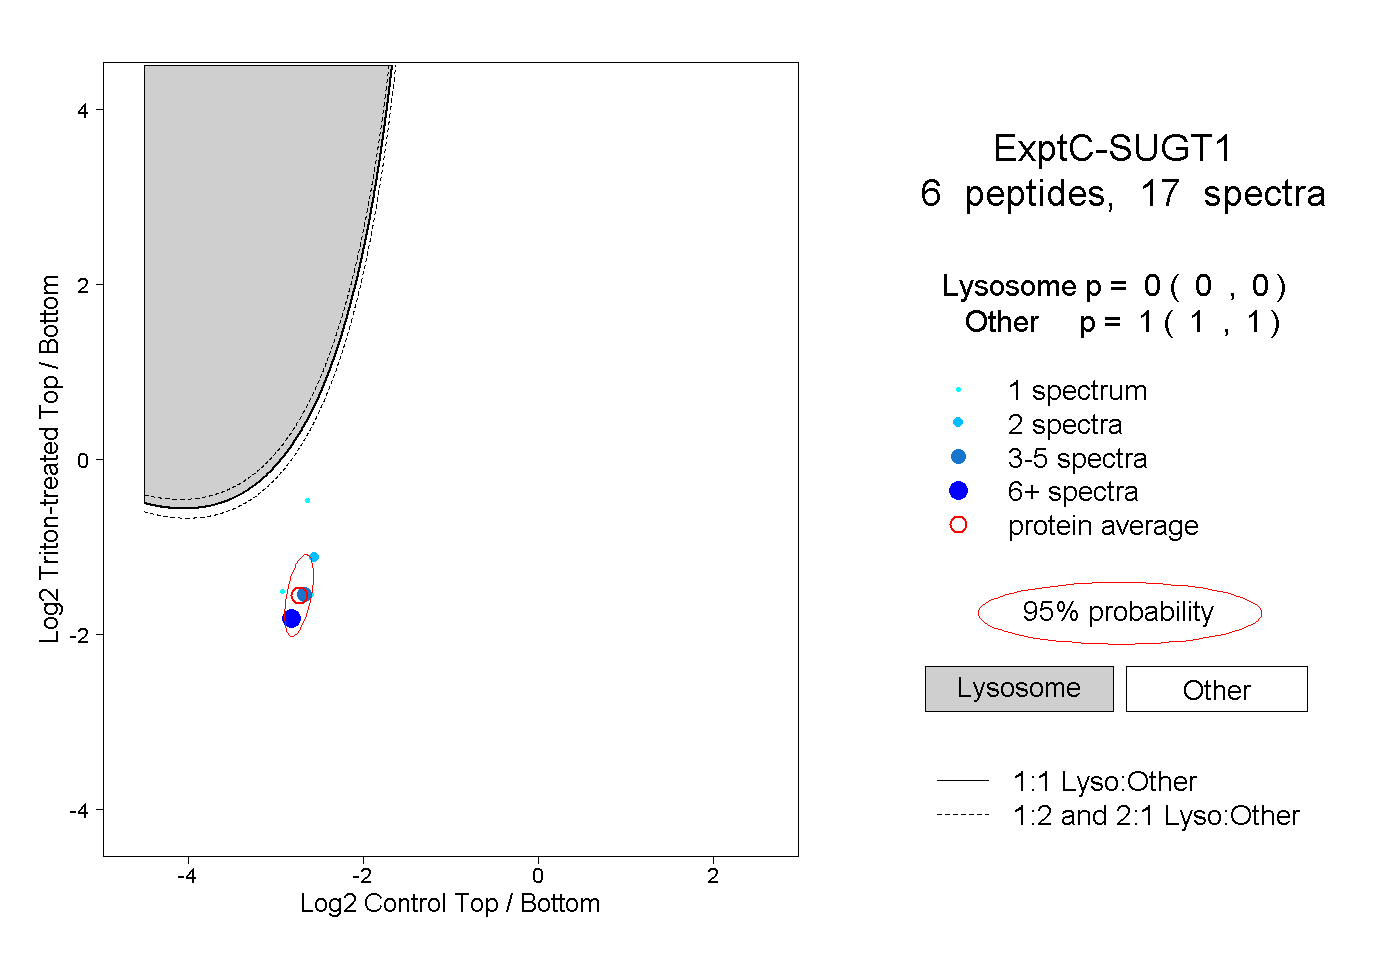
0.000 | 0.000
1.000 | 1.000