 7
7peptides
spectra
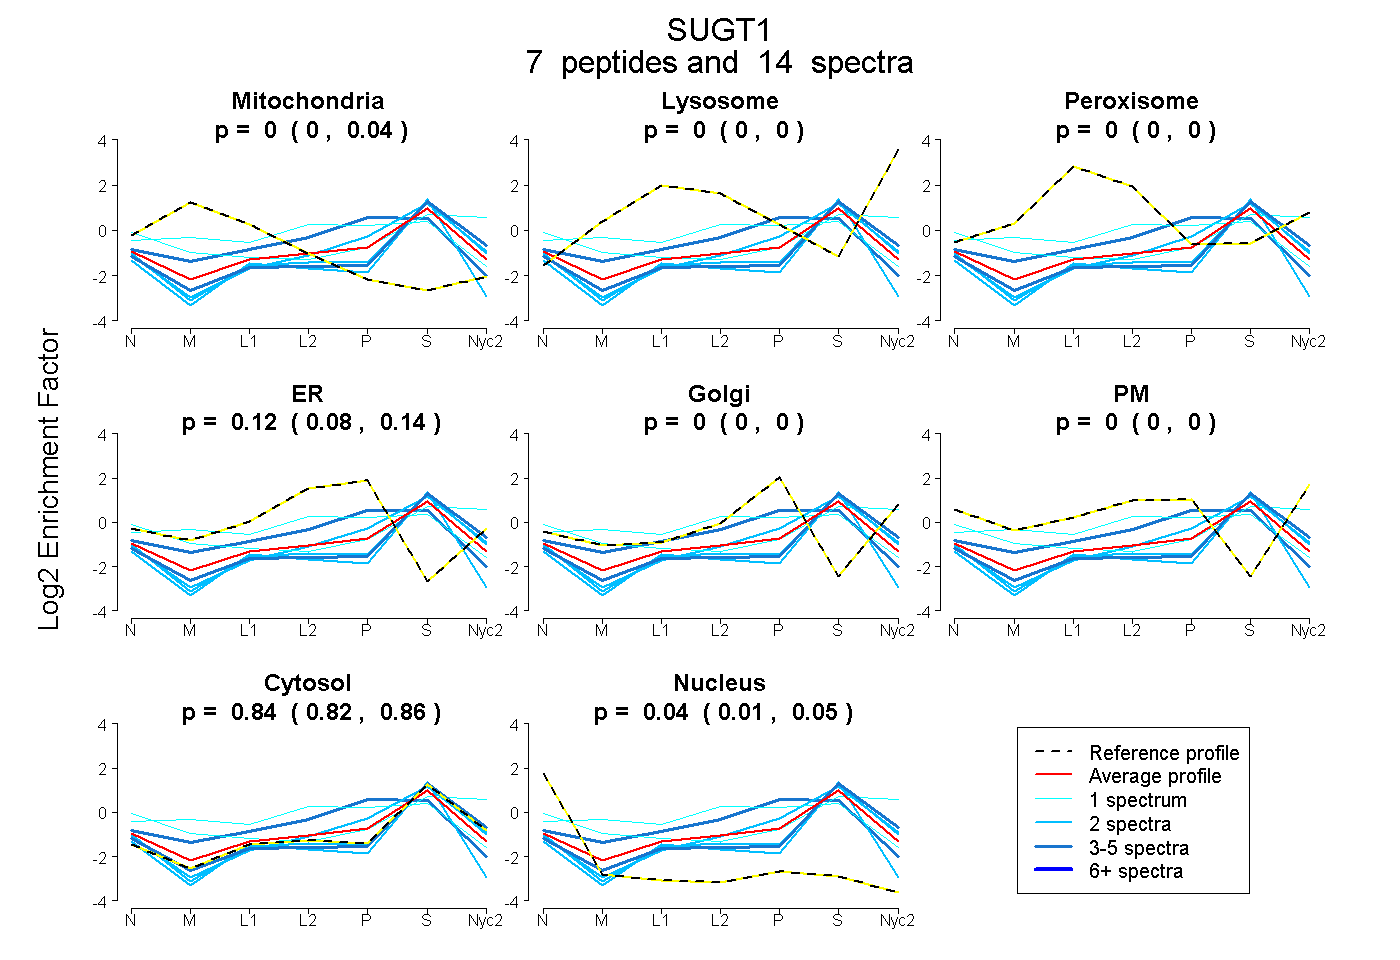
0.000 | 0.039
0.000 | 0.000
0.000 | 0.000
0.084 | 0.137
0.000 | 0.000
0.000 | 0.000
0.817 | 0.859
0.013 | 0.053
| Plot | Mito | Lyso | Perox | ER | Golgi | PM | Cytosol | Nucleus | |||||
| Expt A |
7 peptides |
14 spectra |
|
0.000 0.000 | 0.039 |
0.000 0.000 | 0.000 |
0.000 0.000 | 0.000 |
0.119 0.084 | 0.137 |
0.000 0.000 | 0.000 |
0.000 0.000 | 0.000 |
0.842 0.817 | 0.859 |
0.039 0.013 | 0.053 |
| 1 spectrum, YCDGIADVK | 0.143 | 0.000 | 0.100 | 0.305 | 0.000 | 0.000 | 0.453 | 0.000 | ||
| 3 spectra, VDFSEK | 0.000 | 0.000 | 0.000 | 0.000 | 0.000 | 0.000 | 0.968 | 0.032 | ||
| 2 spectra, SLELNPNNSTALLR | 0.000 | 0.000 | 0.000 | 0.000 | 0.000 | 0.000 | 0.946 | 0.054 | ||
| 2 spectra, AYCHILLGK | 0.000 | 0.000 | 0.000 | 0.000 | 0.000 | 0.000 | 0.830 | 0.170 | ||
| 3 spectra, ALEQNPDDAQYYCQR | 0.027 | 0.000 | 0.000 | 0.349 | 0.000 | 0.000 | 0.624 | 0.000 | ||
| 1 spectrum, LLHPIIPEQSTFK | 0.026 | 0.025 | 0.000 | 0.000 | 0.000 | 0.278 | 0.671 | 0.000 | ||
| 2 spectra, LEGQGDVPAPK | 0.000 | 0.000 | 0.000 | 0.000 | 0.114 | 0.000 | 0.886 | 0.000 |
| Plot | Mito | Lyso or Perox | ER | Golgi | PM | Cytosol | Nucleus | ||||||
| Expt B |
2 peptides |
2 spectra |
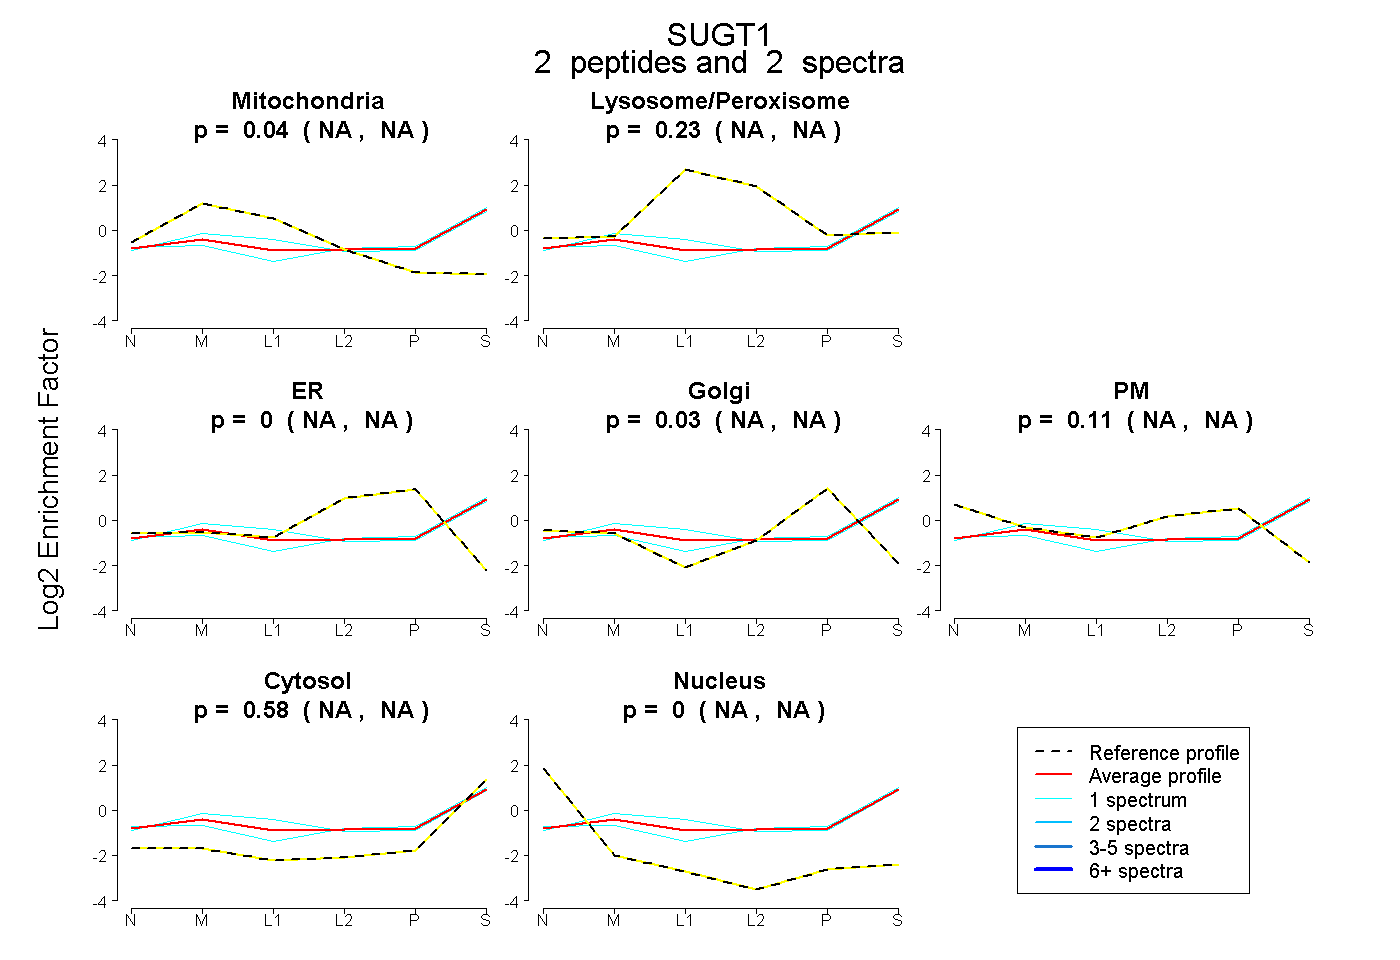 |
0.042 NA | NA |
0.233 NA | NA |
0.000 NA | NA |
0.028 NA | NA |
0.114 NA | NA |
0.583 NA | NA |
0.000 NA | NA |
|||
| Plot | Lyso | Other | |||||||||||
| Expt C |
6 peptides |
17 spectra |
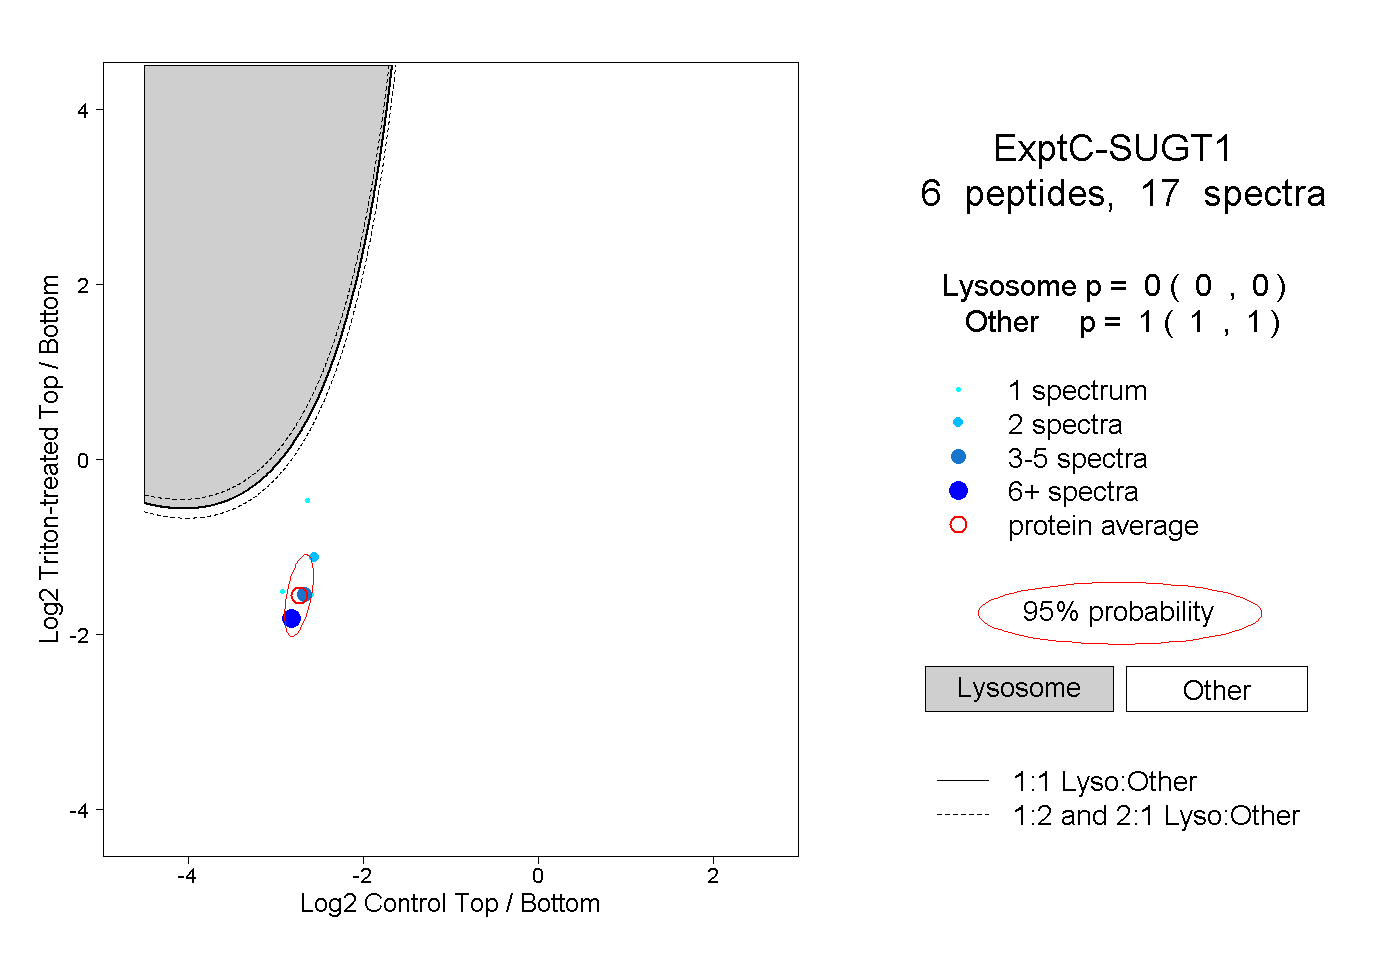 |
0.000 0.000 | 0.000 |
1.000 1.000 | 1.000 |