SUGT1
[ENSRNOP00000017086]
Main page
| | | Plot |
Mito |
Lyso |
|
Perox |
ER |
Golgi |
PM |
Cytosol |
Nucleus |
|
| Expt A |
 7
7
peptides |
14
spectra |
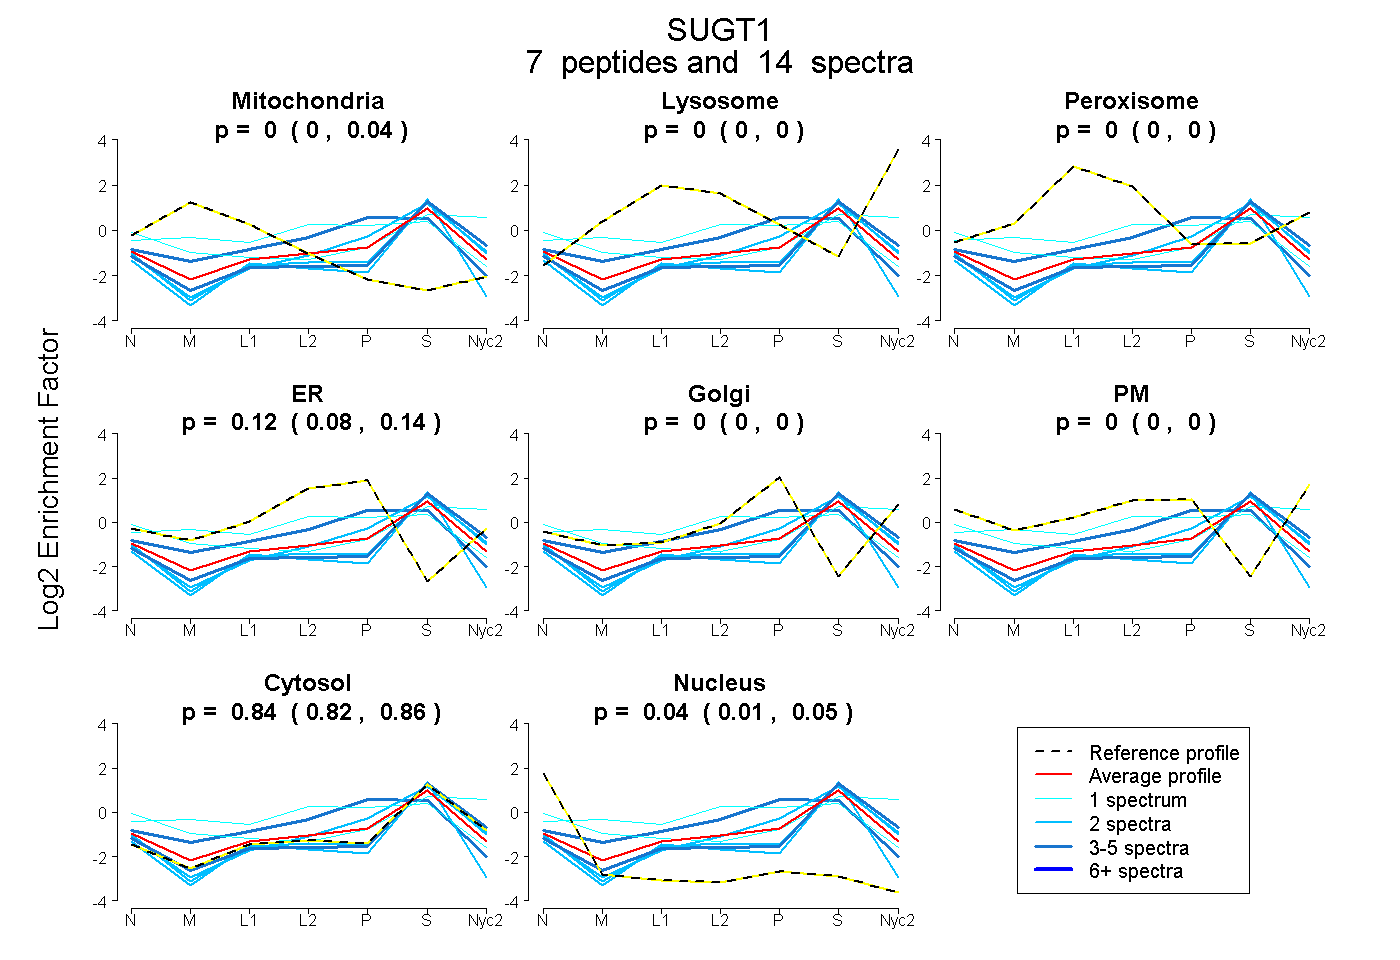 |
0.000
0.000 | 0.039 |
0.000
0.000 | 0.000 |
|
0.000
0.000 | 0.000 |
0.119
0.084 | 0.137 |
0.000
0.000 | 0.000 |
0.000
0.000 | 0.000 |
0.842
0.817 | 0.859 |
0.039
0.013 | 0.053 |
|
| | | Plot |
Mito |
|
Lyso or Perox |
|
ER |
Golgi |
PM |
Cytosol |
Nucleus |
|
| Expt B |
2
peptides |
2
spectra |
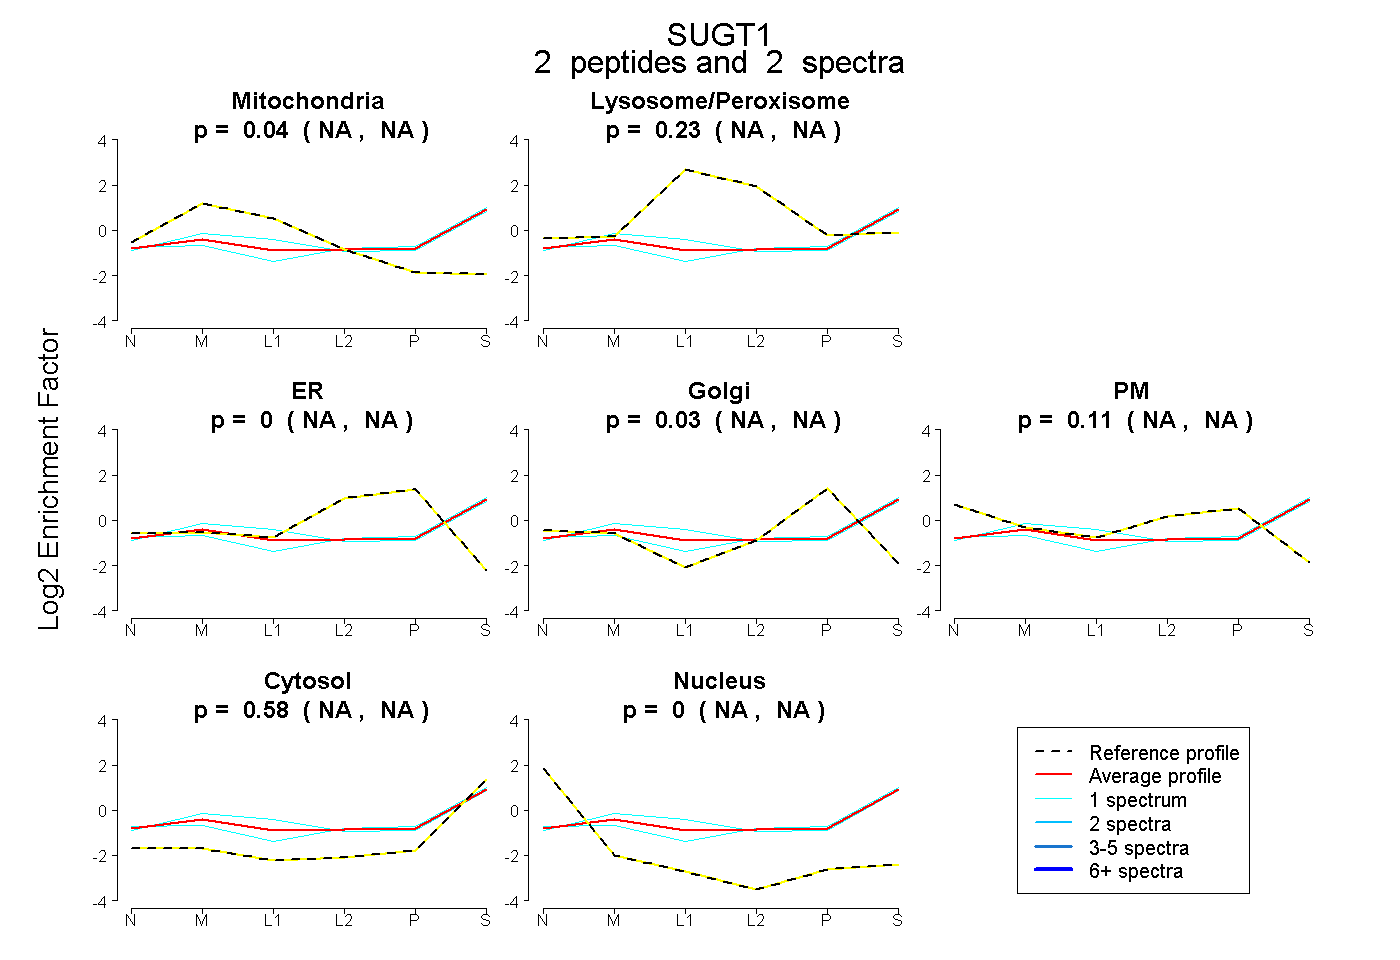 |
0.042
NA | NA |
|
0.233
NA | NA |
|
0.000
NA | NA |
0.028
NA | NA |
0.114
NA | NA |
0.583
NA | NA |
0.000
NA | NA |
|
| | | Plot |
|
Lyso |
|
|
|
|
|
|
|
Other |
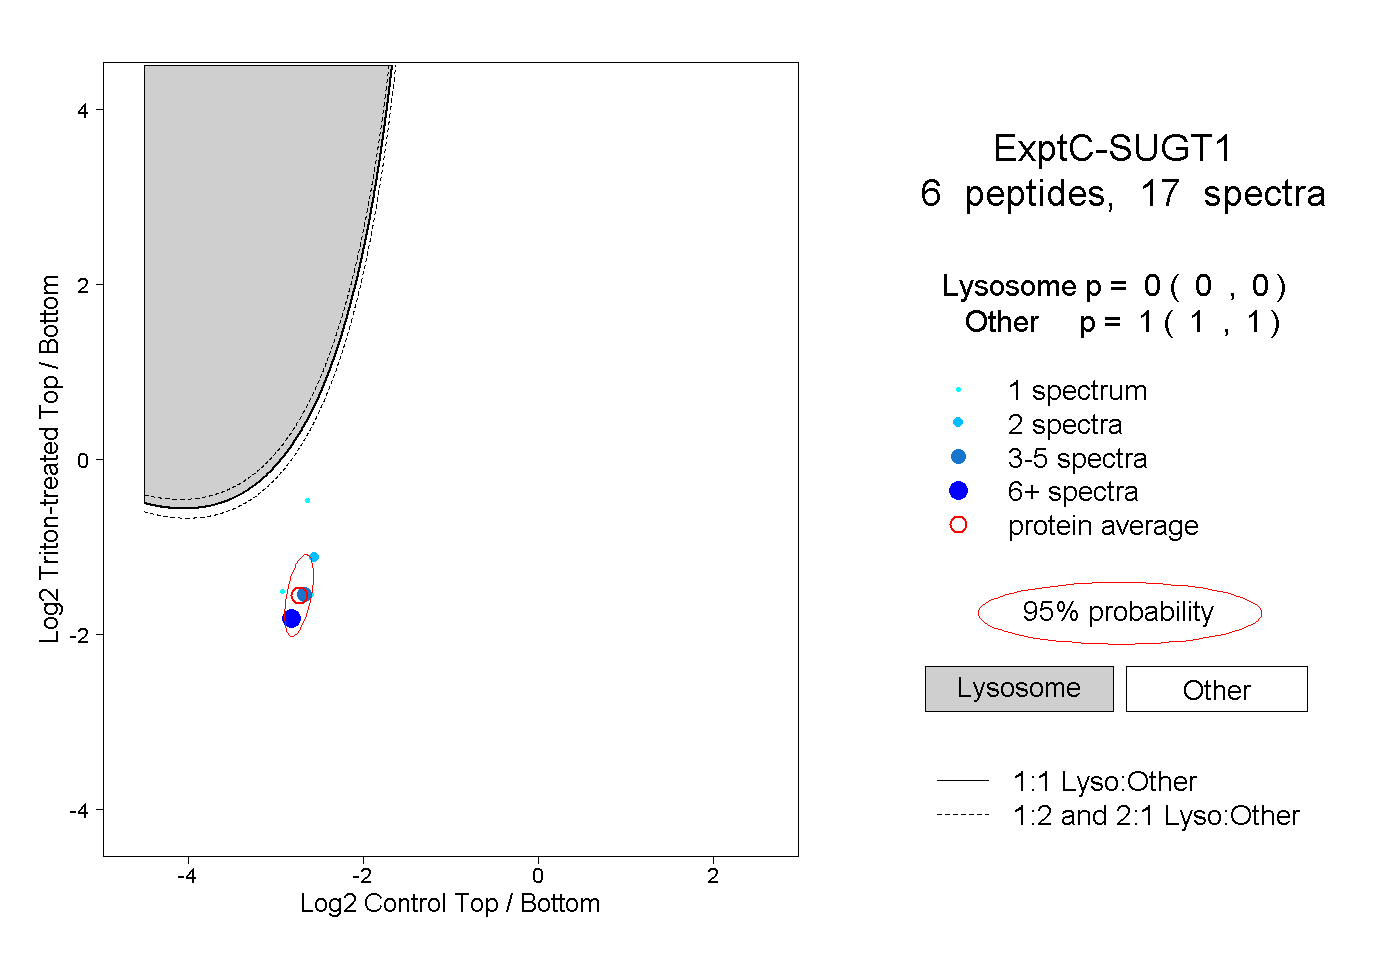
| Expt C |
6
peptides |
17
spectra |
 |
|
0.000
0.000 | 0.000 |
|
|
|
|
|
|
|
1.000
1.000 | 1.000 |
| 1 spectrum, KPEAVR |
|
0.000 |
|
|
|
|
|
|
|
1.000 |
| 4 spectra, VDFSEK |
|
0.000 |
|
|
|
|
|
|
|
1.000 |
| 1 spectrum, ELSAVVK |
|
0.000 |
|
|
|
|
|
|
|
1.000 |
| 2 spectra, IPSGEDCSLK |
|
0.000 |
|
|
|
|
|
|
|
1.000 |
| 8 spectra, LLHPIIPEQSTFK |
|
0.000 |
|
|
|
|
|
|
|
1.000 |
| 1 spectrum, GICEYYEK |
|
0.000 |
|
|
|
|
|
|
|
1.000 |