 8
8peptides
spectra
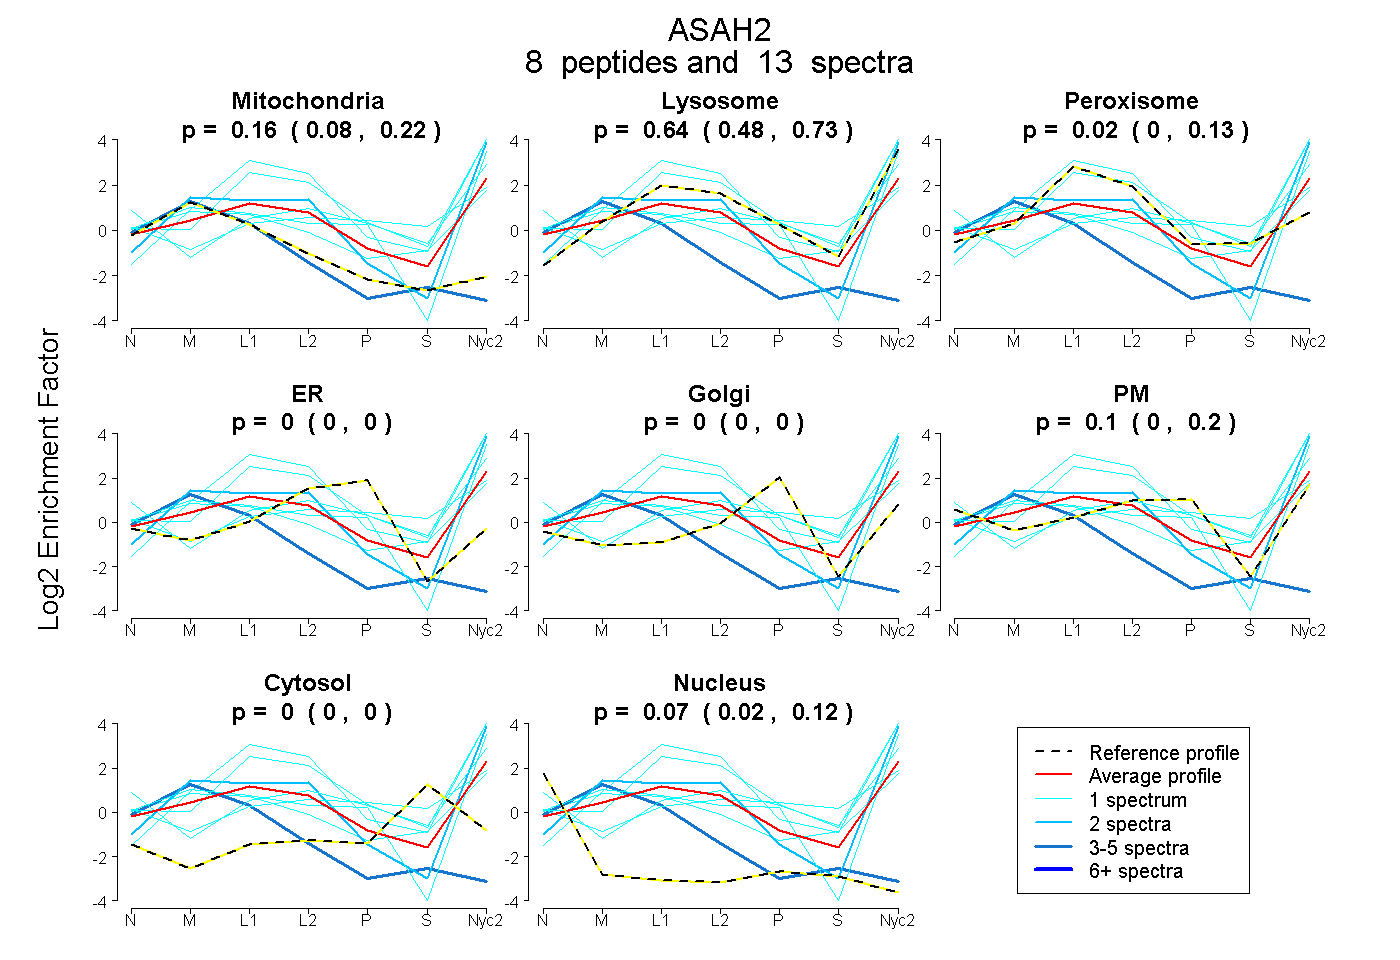
0.077 | 0.216
0.480 | 0.733
0.000 | 0.130
0.000 | 0.000
0.000 | 0.000
0.000 | 0.198
0.000 | 0.000
0.019 | 0.119
5peptides
spectra
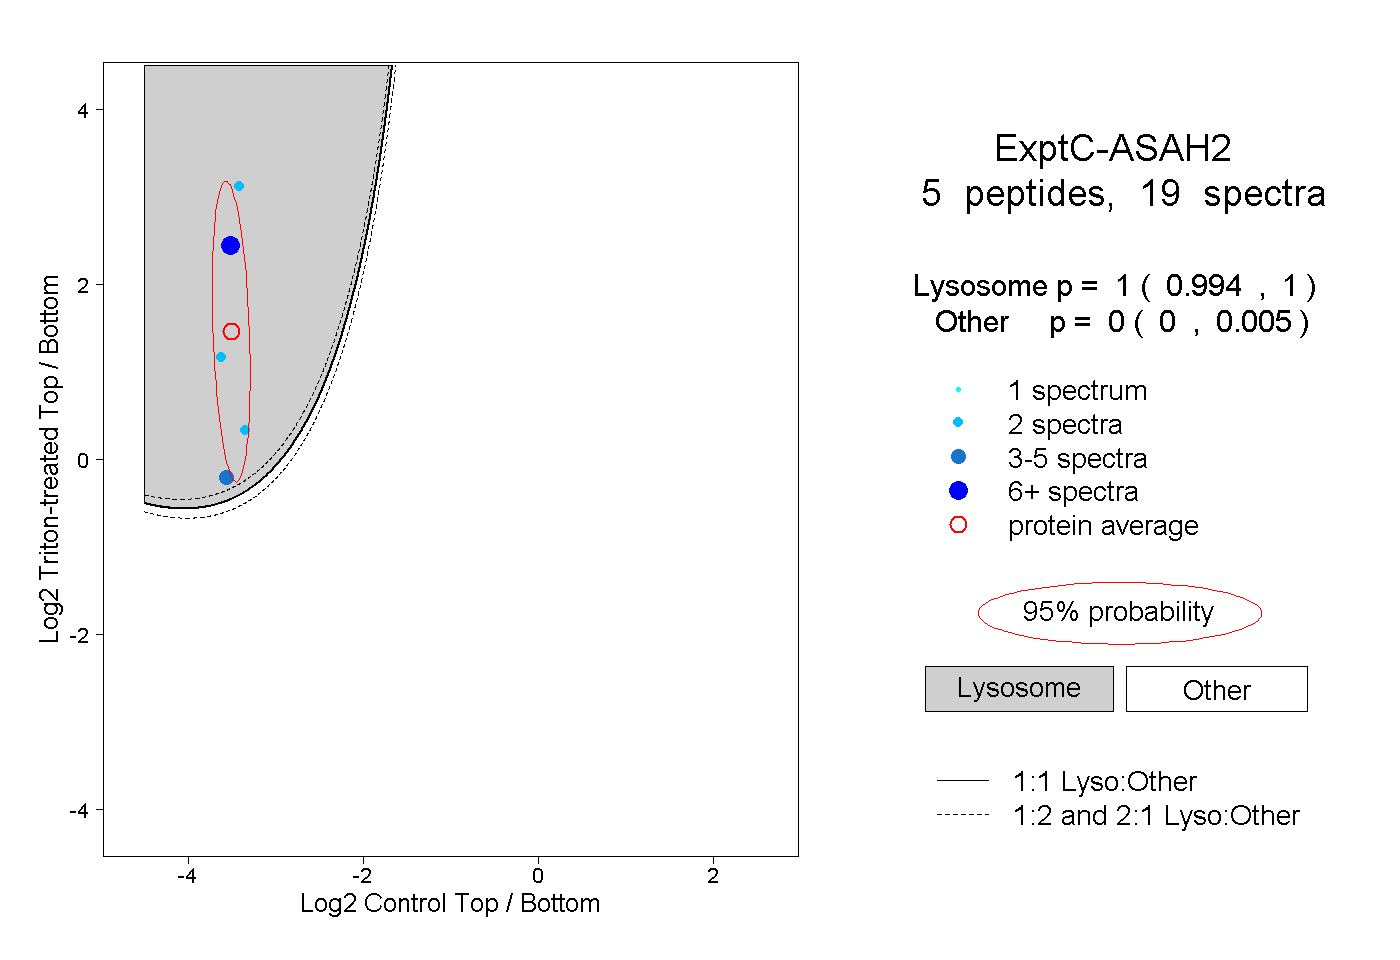
0.994 | 1.000
0.000 | 0.005
2peptides
spectra
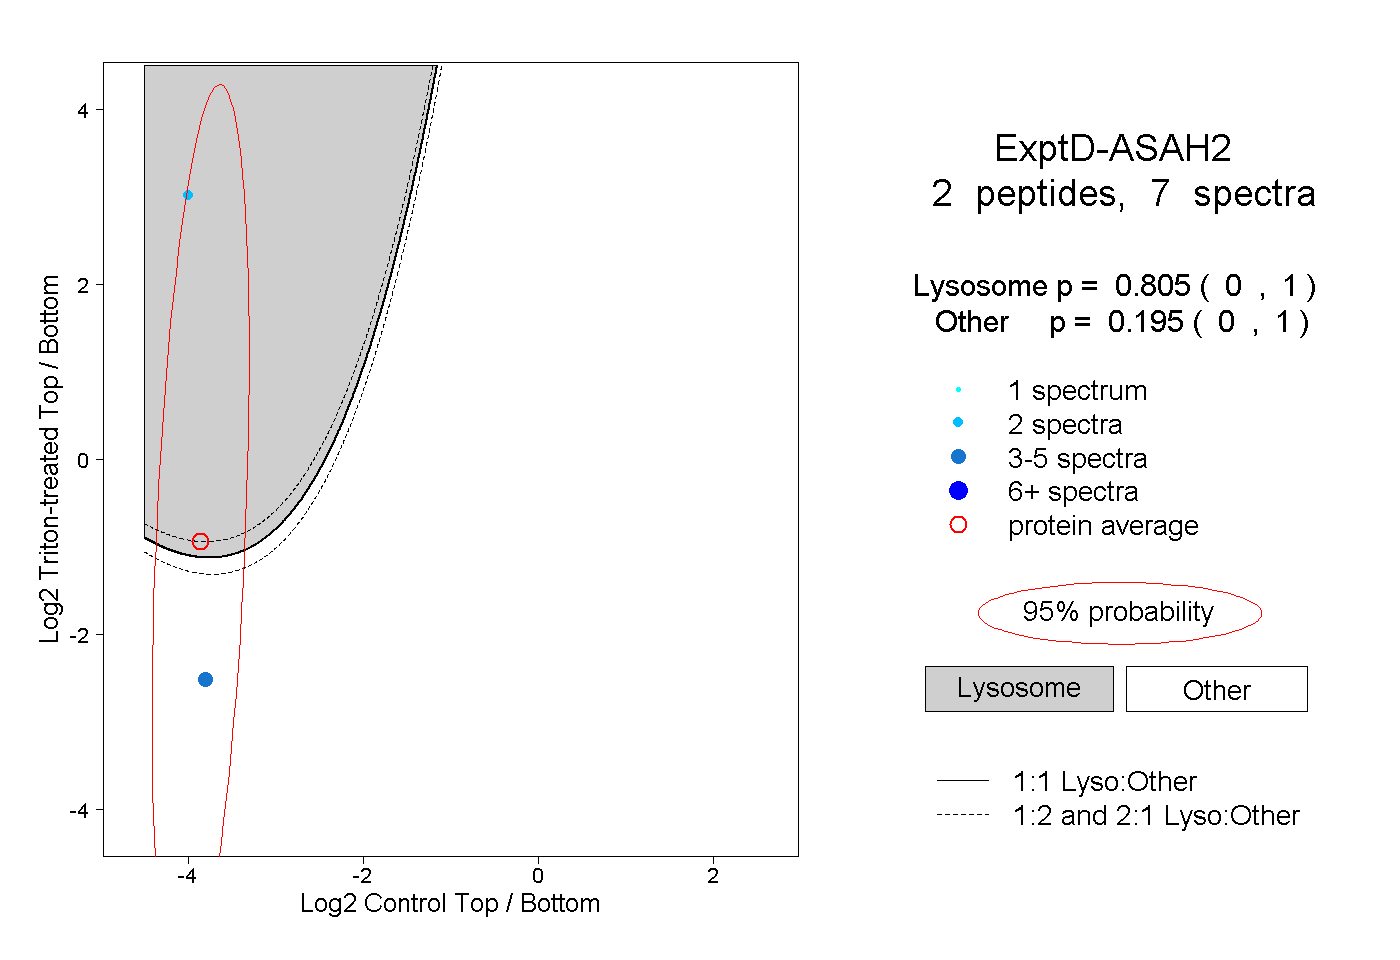
0.000 | 1.000
0.000 | 1.000