 8
8peptides
spectra
0.077 | 0.216
0.480 | 0.733
0.000 | 0.130
0.000 | 0.000
0.000 | 0.000
0.000 | 0.198
0.000 | 0.000
0.019 | 0.119
5peptides
spectra
0.994 | 1.000
0.000 | 0.005
| Plot | Mito | Lyso | Perox | ER | Golgi | PM | Cytosol | Nucleus | |||||
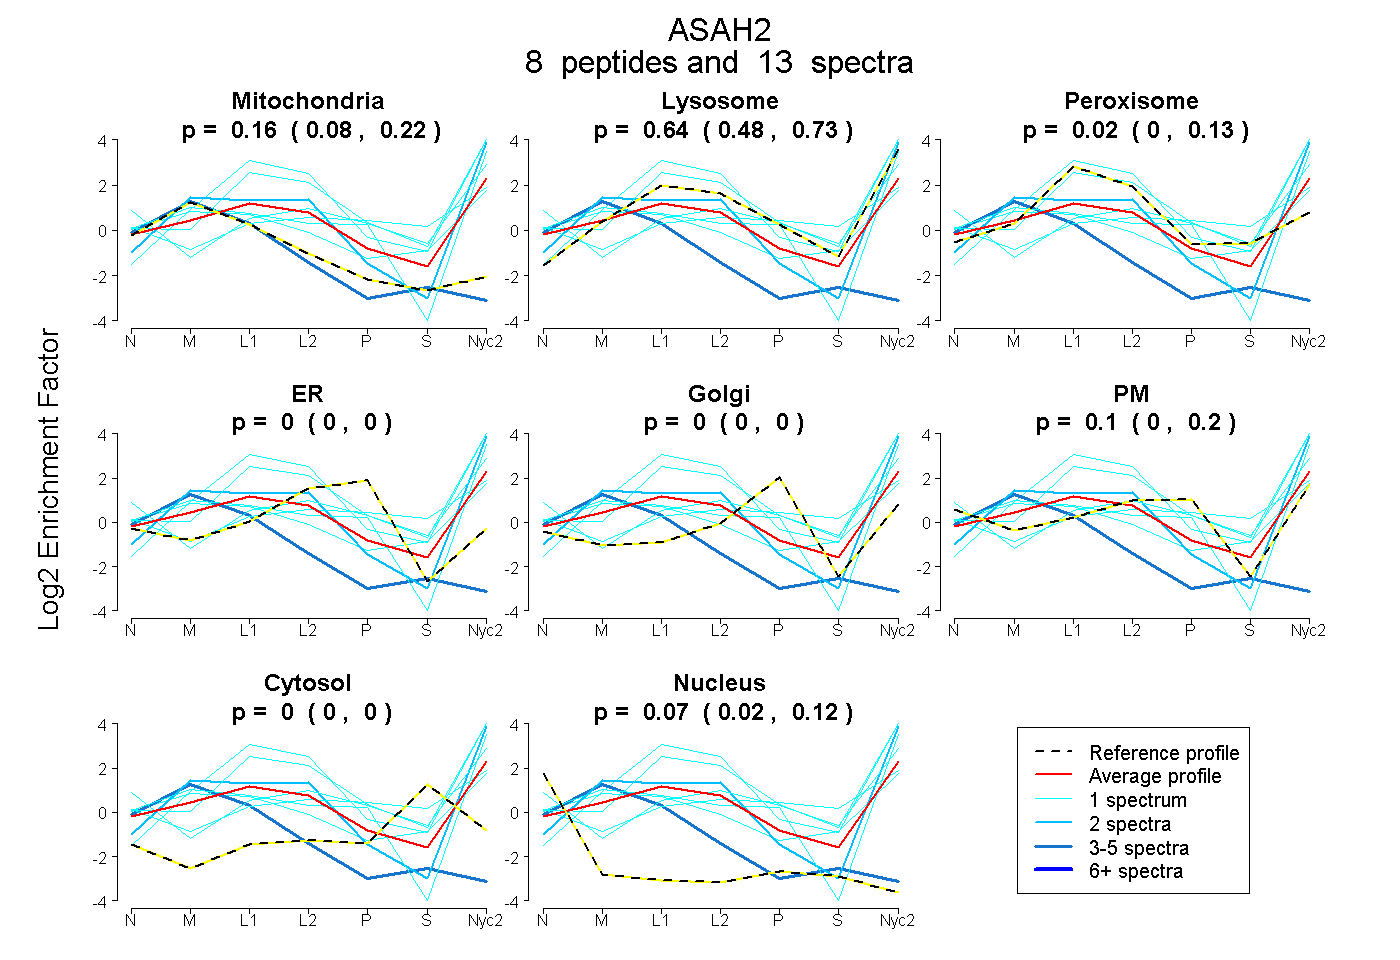
| Expt A |
8 peptides |
13 spectra |
|
0.159 0.077 | 0.216 |
0.639 0.480 | 0.733 |
0.024 0.000 | 0.130 |
0.000 0.000 | 0.000 |
0.000 0.000 | 0.000 |
0.104 0.000 | 0.198 |
0.000 0.000 | 0.000 |
0.074 0.019 | 0.119 |
||
| Plot | Lyso | Other | |||||||||||
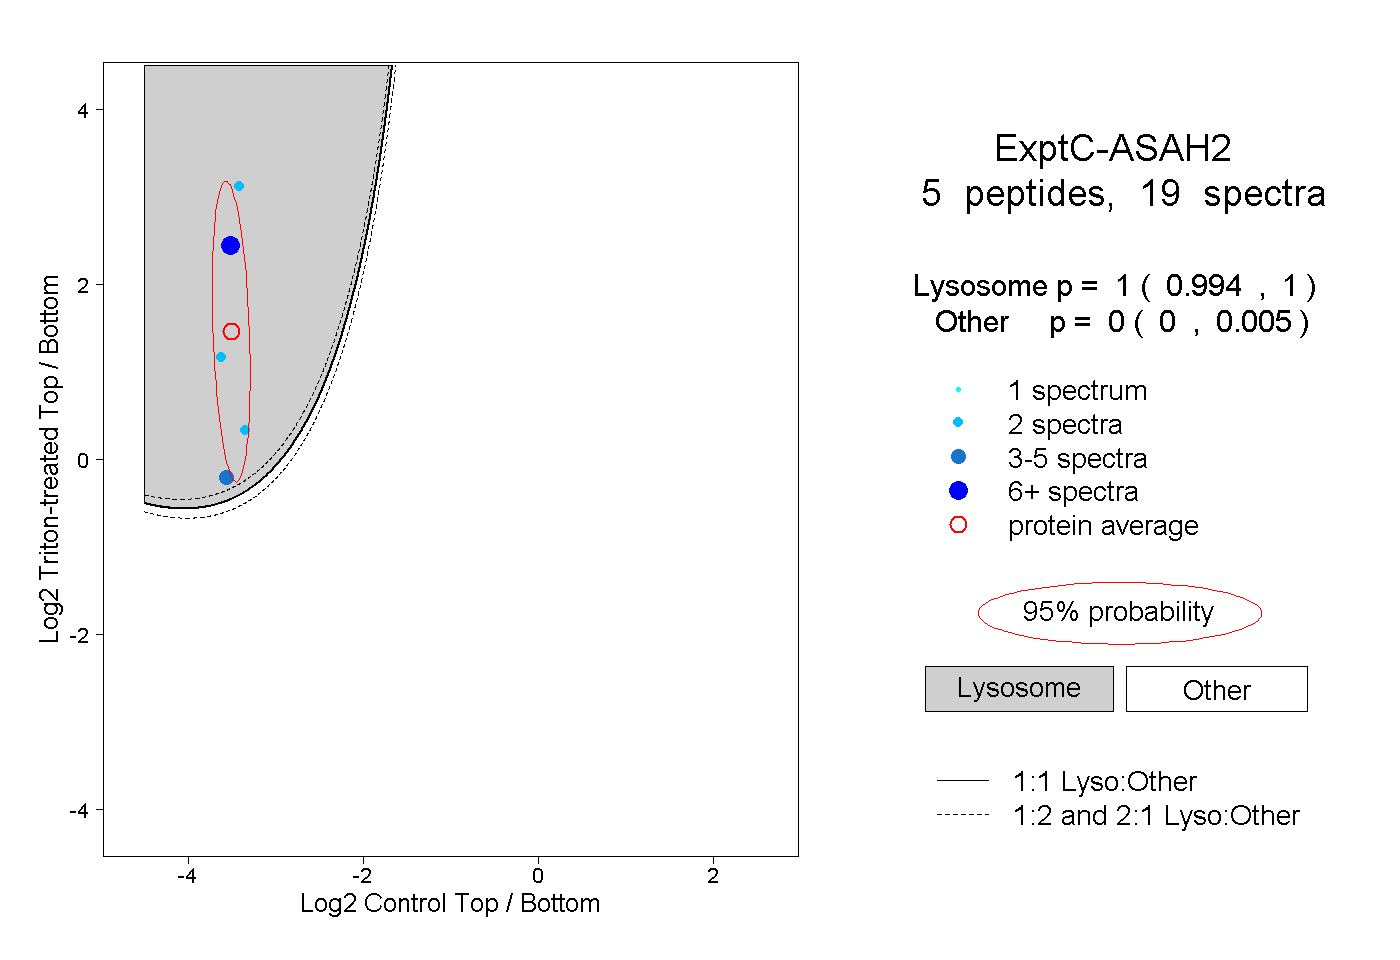
| Expt C |
5 peptides |
19 spectra |
|
1.000 0.994 | 1.000 |
0.000 0.000 | 0.005 |
| 2 spectra, QFGDVLQPAKPEYR | 0.999 | 0.001 | ||||||||
| 2 spectra, TFQYIVSGIVK | 1.000 | 0.000 | ||||||||
| 5 spectra, AFILADPDGSNR | 0.951 | 0.049 | ||||||||
| 8 spectra, GNVANVQINR | 1.000 | 0.000 | ||||||||
| 2 spectra, EFALYGMK | 1.000 | 0.000 |
| Plot | Lyso | Other | |||||||||||
| Expt D |
2 peptides |
7 spectra |
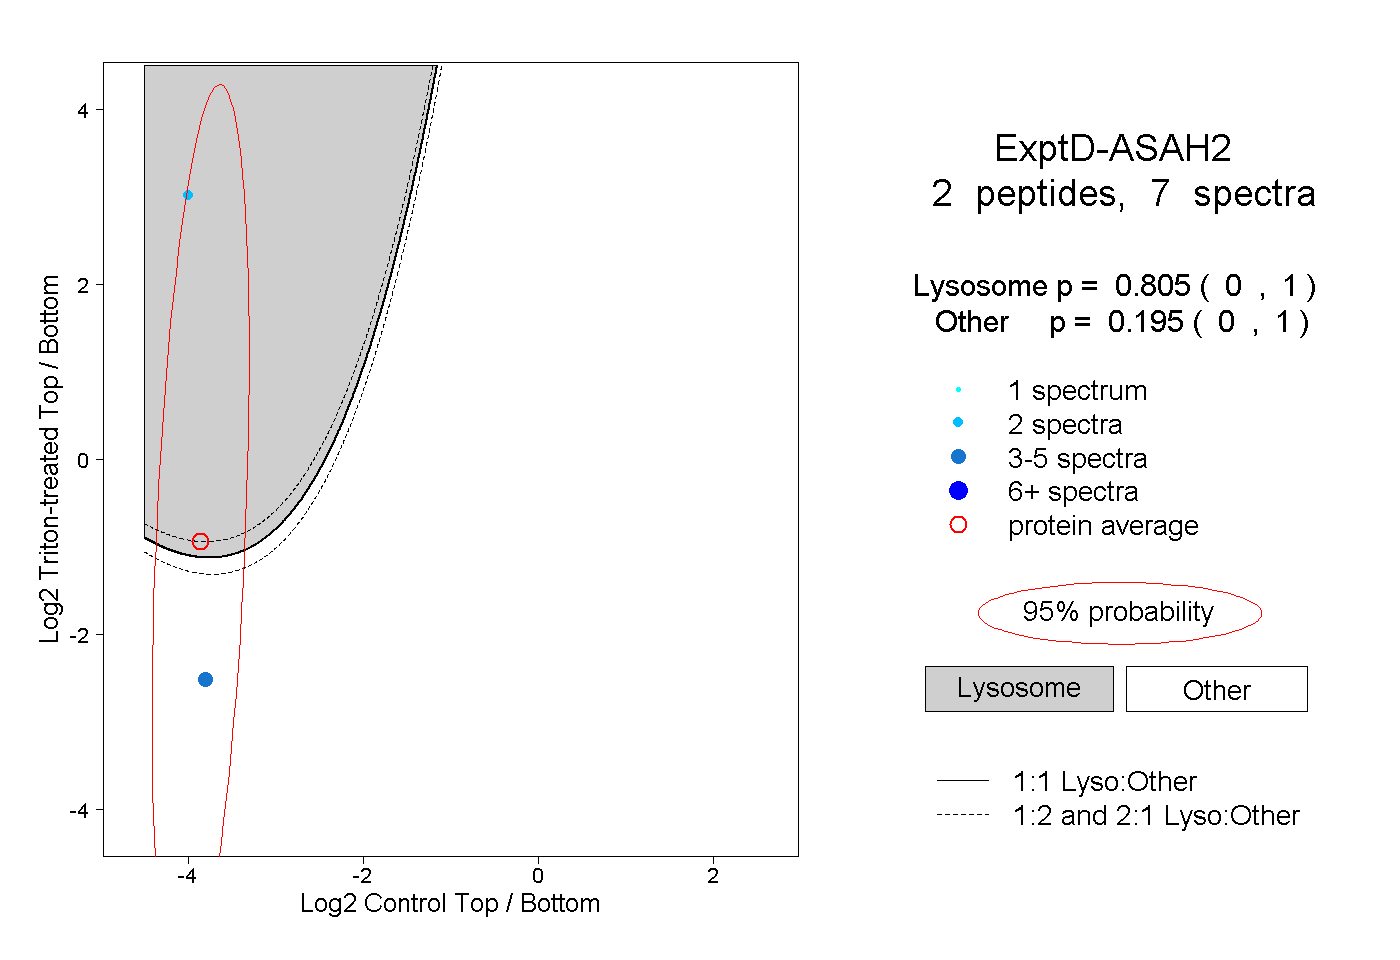 |
0.805 0.000 | 1.000 |
0.195 0.000 | 1.000 |