 8
8peptides
spectra
0.077 | 0.216
0.480 | 0.733
0.000 | 0.130
0.000 | 0.000
0.000 | 0.000
0.000 | 0.198
0.000 | 0.000
0.019 | 0.119
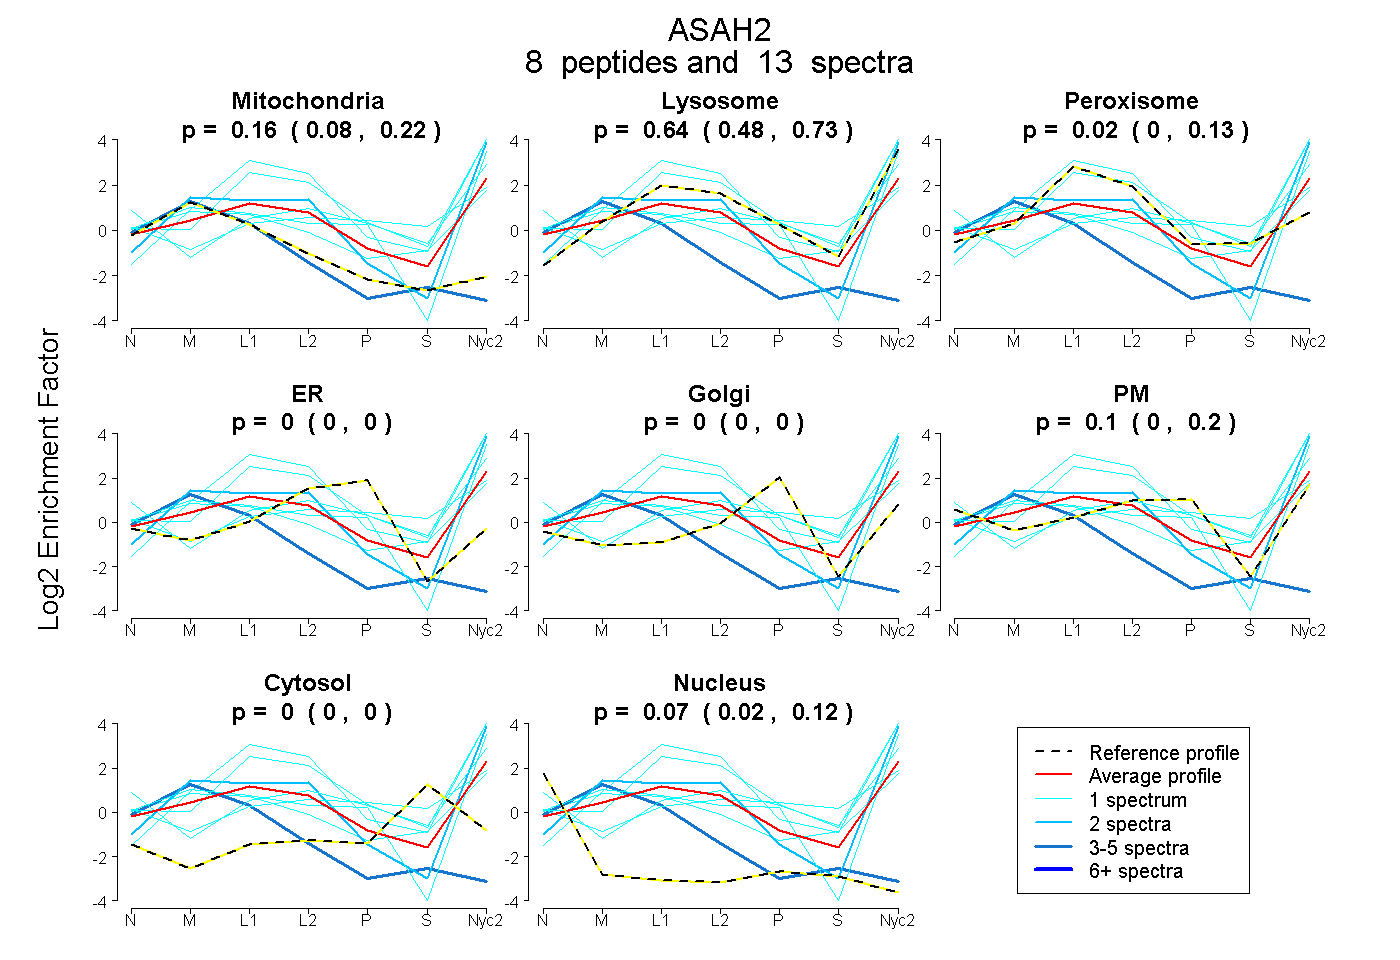
| Plot | Mito | Lyso | Perox | ER | Golgi | PM | Cytosol | Nucleus | |||||
| Expt A |
8 peptides |
13 spectra |
|
0.159 0.077 | 0.216 |
0.639 0.480 | 0.733 |
0.024 0.000 | 0.130 |
0.000 0.000 | 0.000 |
0.000 0.000 | 0.000 |
0.104 0.000 | 0.198 |
0.000 0.000 | 0.000 |
0.074 0.019 | 0.119 |
| 1 spectrum, TFQYIVSGIVK | 0.039 | 0.326 | 0.000 | 0.000 | 0.000 | 0.635 | 0.000 | 0.000 | ||
| 1 spectrum, YFGHNR | 0.000 | 0.310 | 0.017 | 0.000 | 0.000 | 0.362 | 0.311 | 0.000 | ||
| 1 spectrum, QFGDVLQPAKPEYR | 0.000 | 0.856 | 0.104 | 0.000 | 0.000 | 0.040 | 0.000 | 0.000 | ||
| 1 spectrum, ADCTGQVSDINLMGYGK | 0.280 | 0.582 | 0.000 | 0.000 | 0.000 | 0.000 | 0.056 | 0.082 | ||
| 1 spectrum, GNVANVQINR | 0.000 | 0.944 | 0.056 | 0.000 | 0.000 | 0.000 | 0.000 | 0.000 | ||
| 5 spectra, LEVLK | 0.924 | 0.000 | 0.000 | 0.000 | 0.000 | 0.000 | 0.000 | 0.076 | ||
| 2 spectra, NGQNAQGLLTR | 0.170 | 0.830 | 0.000 | 0.000 | 0.000 | 0.000 | 0.000 | 0.000 | ||
| 1 spectrum, SPSSYLQNPPSER | 0.000 | 0.310 | 0.000 | 0.000 | 0.000 | 0.544 | 0.146 | 0.000 |
| Plot | Lyso | Other | |||||||||||
| Expt C |
5 peptides |
19 spectra |
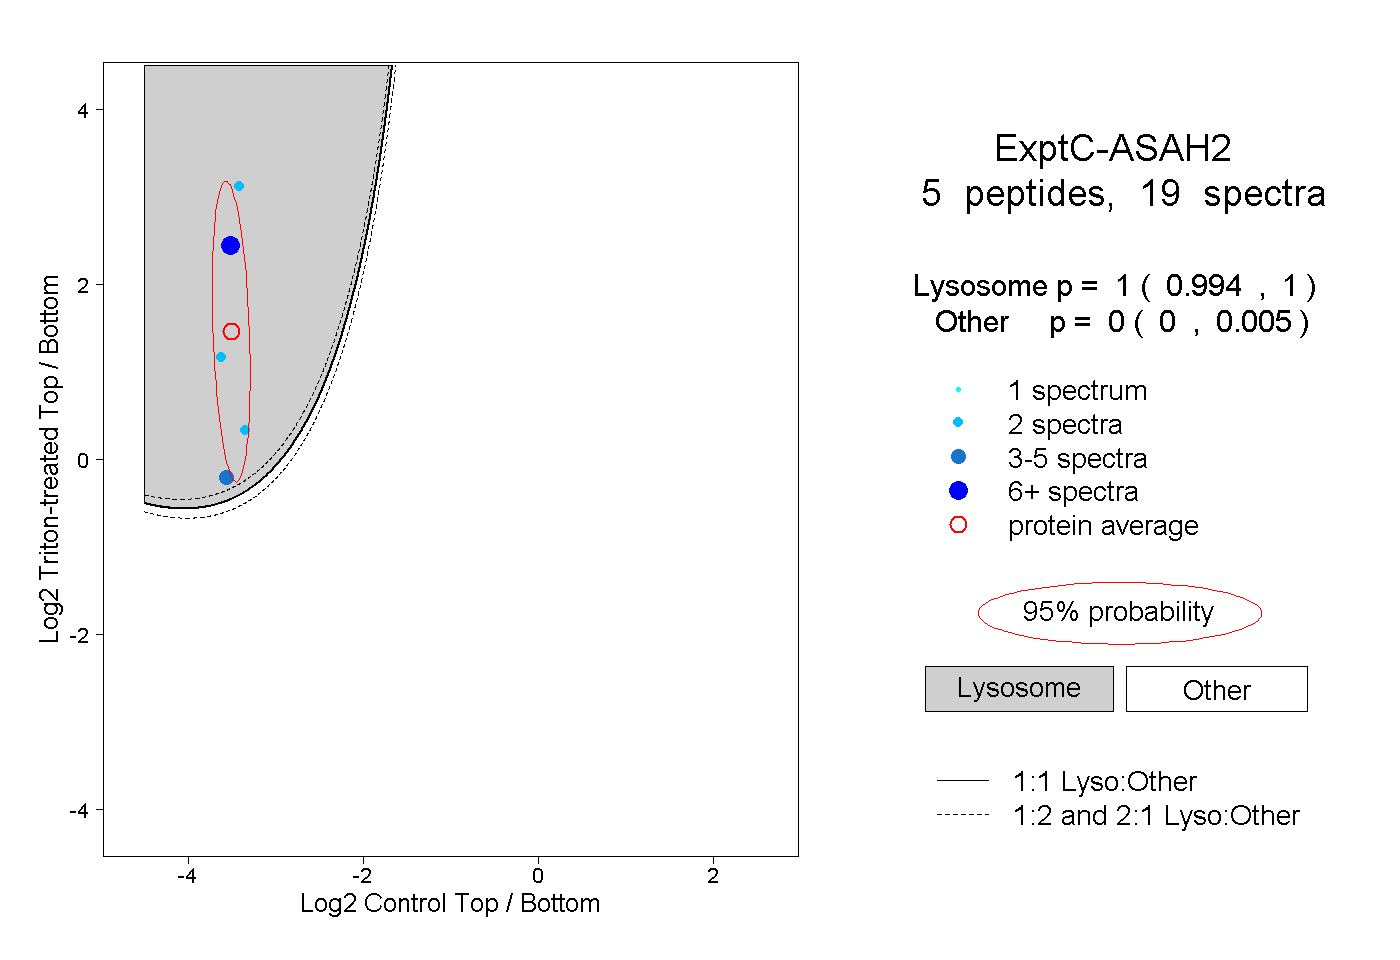 |
1.000 0.994 | 1.000 |
0.000 0.000 | 0.005 |
||||||||
| Plot | Lyso | Other | |||||||||||
| Expt D |
2 peptides |
7 spectra |
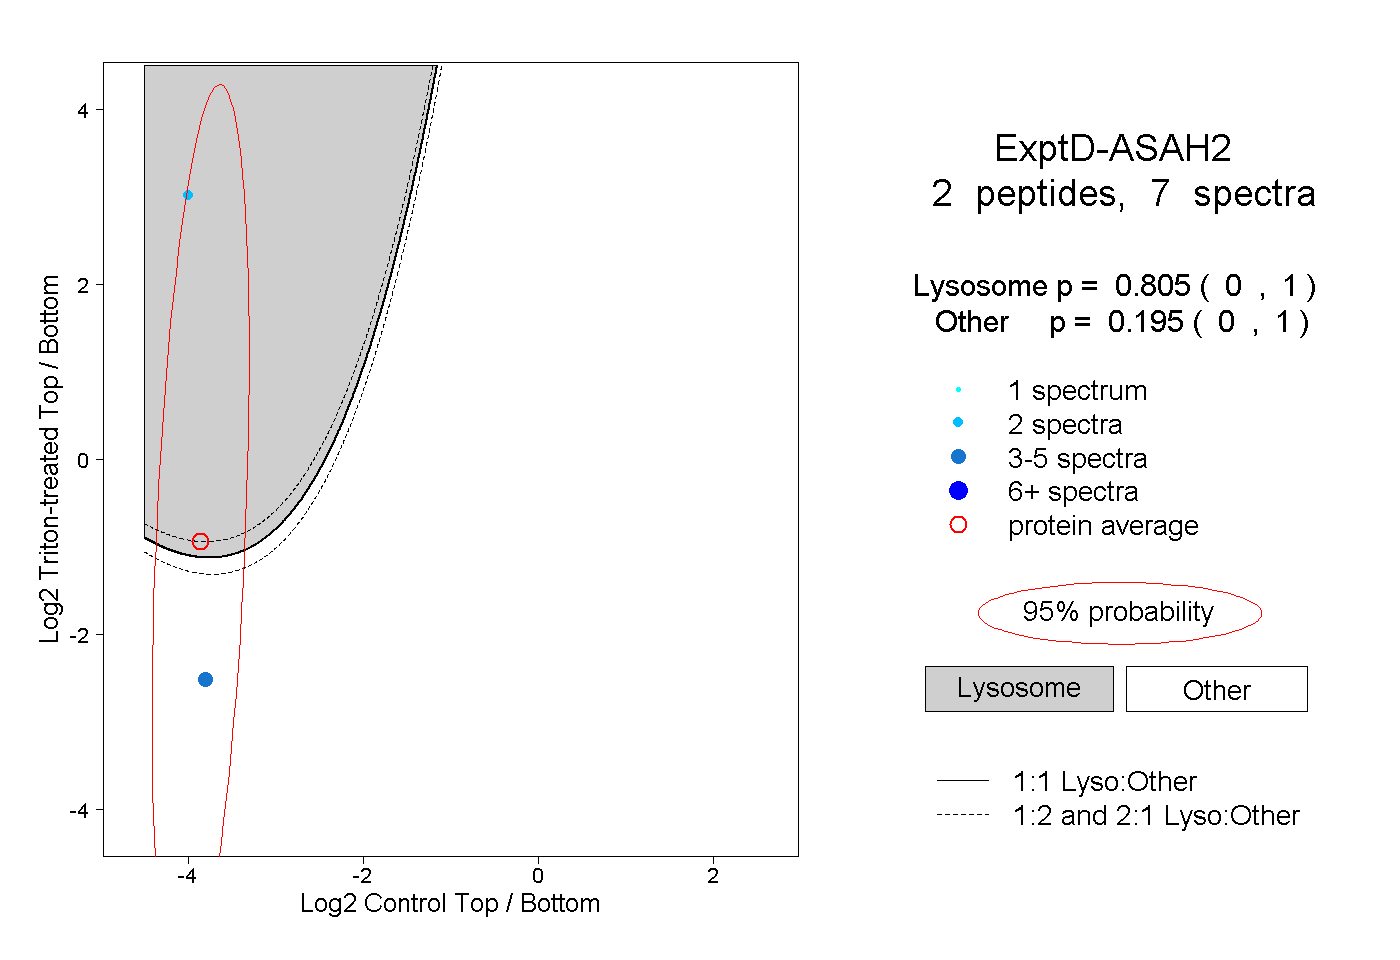 |
0.805 0.000 | 1.000 |
0.195 0.000 | 1.000 |