 10
10peptides
spectra
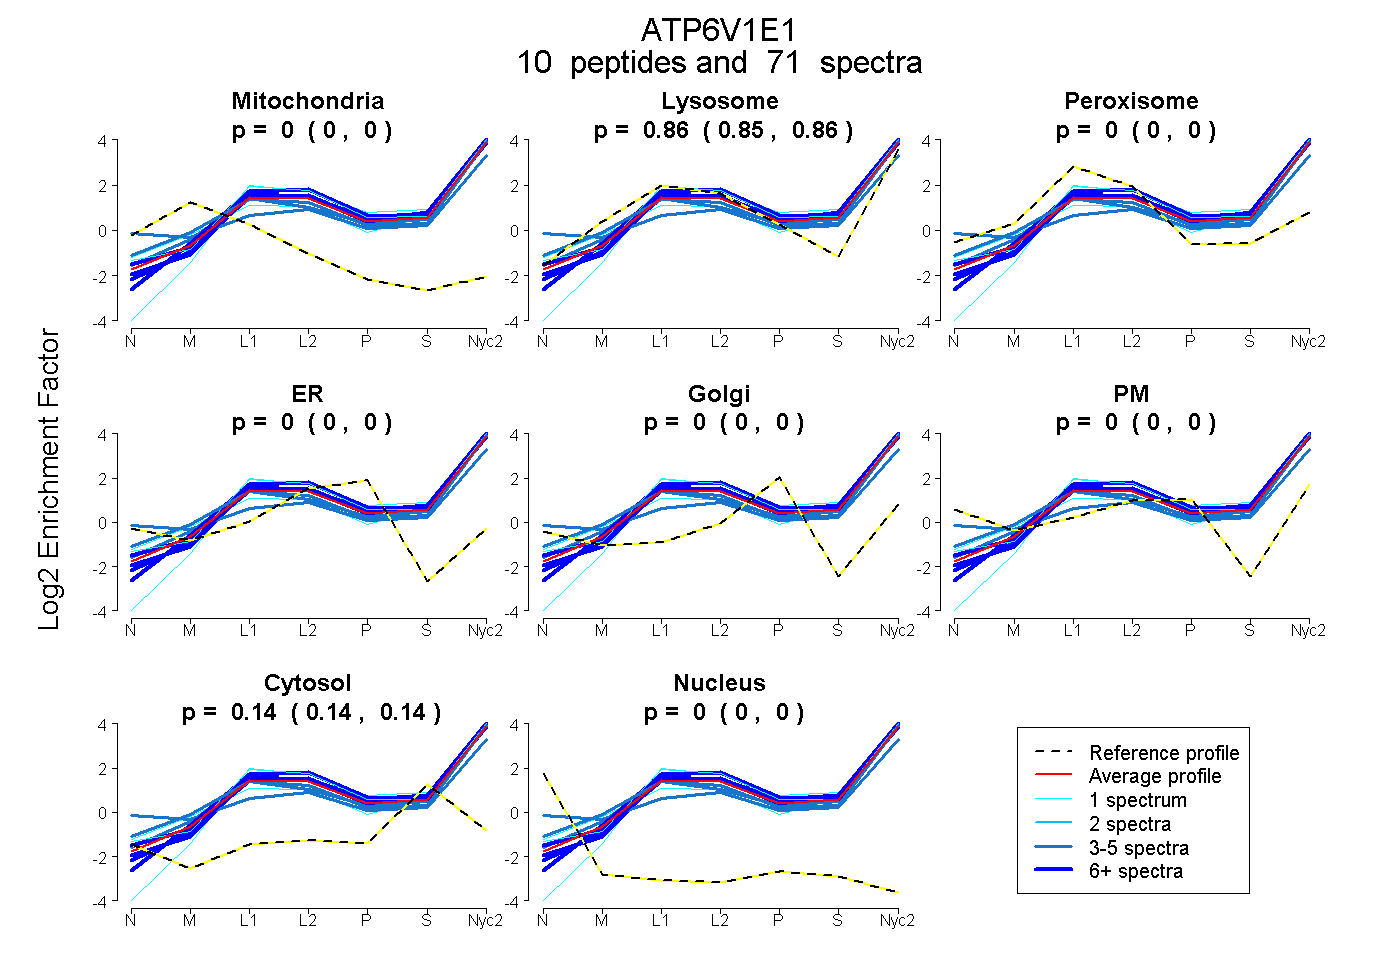
0.000 | 0.000
0.855 | 0.860
0.000 | 0.000
0.000 | 0.000
0.000 | 0.000
0.000 | 0.000
0.139 | 0.145
0.000 | 0.000
4peptides
spectra
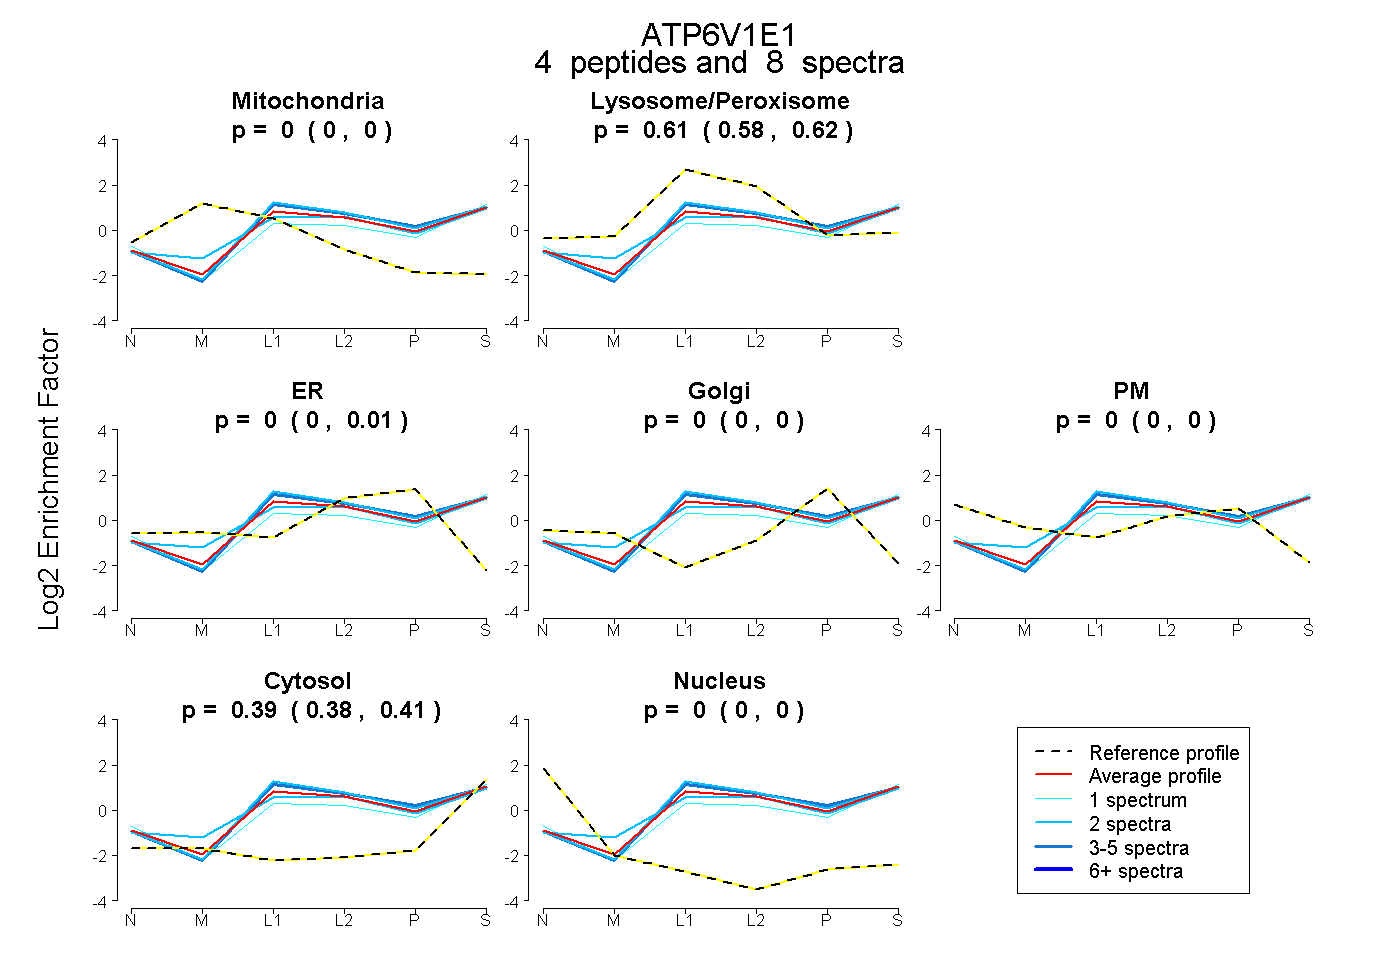
0.000 | 0.000
0.581 | 0.621
0.000 | 0.014
0.000 | 0.000
0.000 | 0.000
0.375 | 0.407
0.000 | 0.000
12peptides
spectra
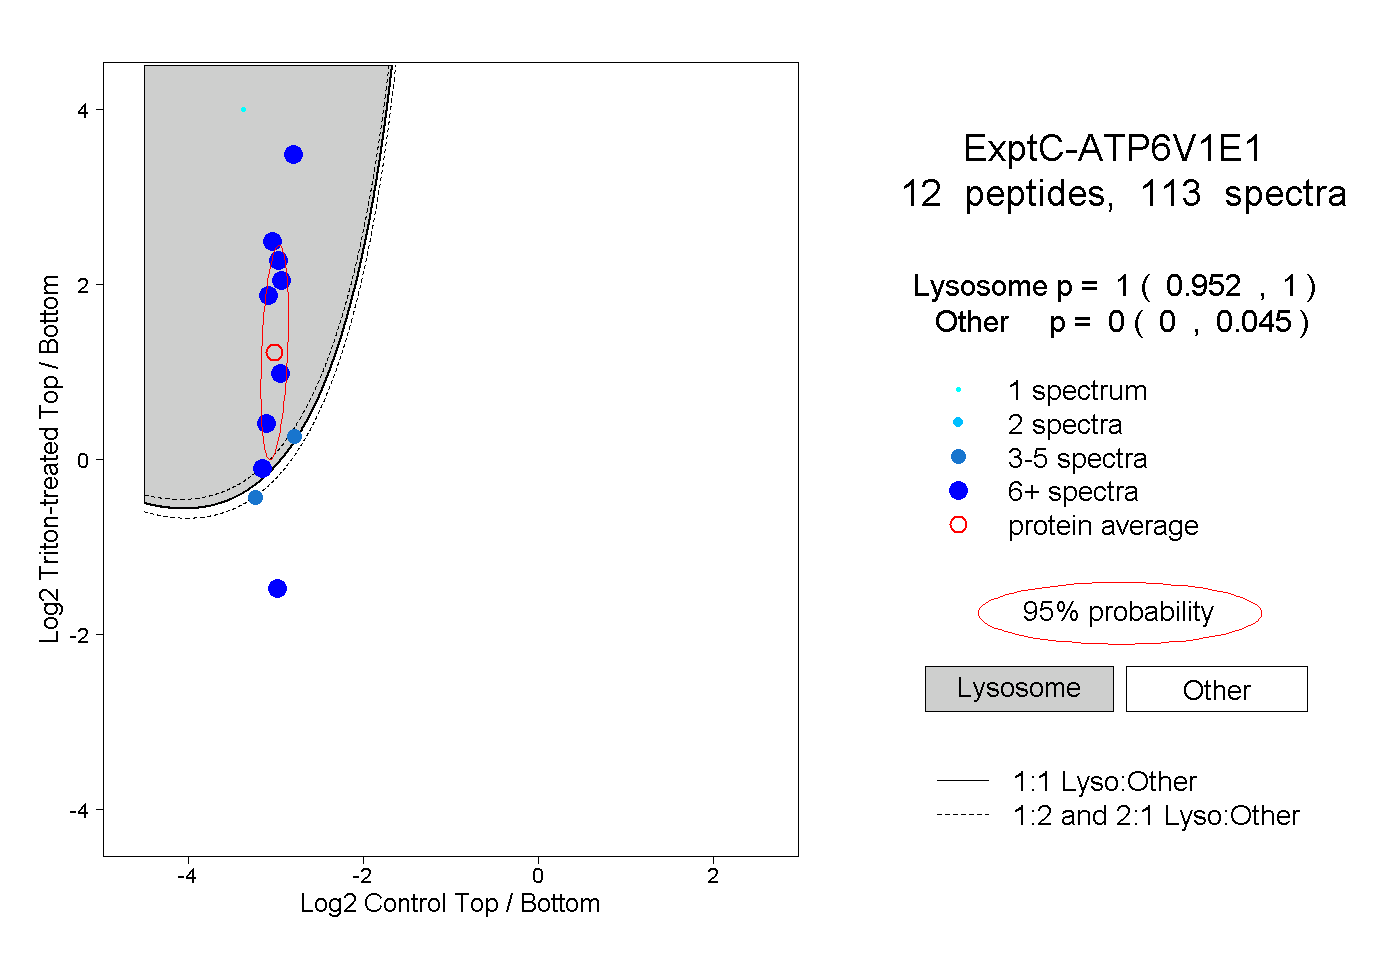
0.952 | 1.000
0.000 | 0.045
5peptides
spectra
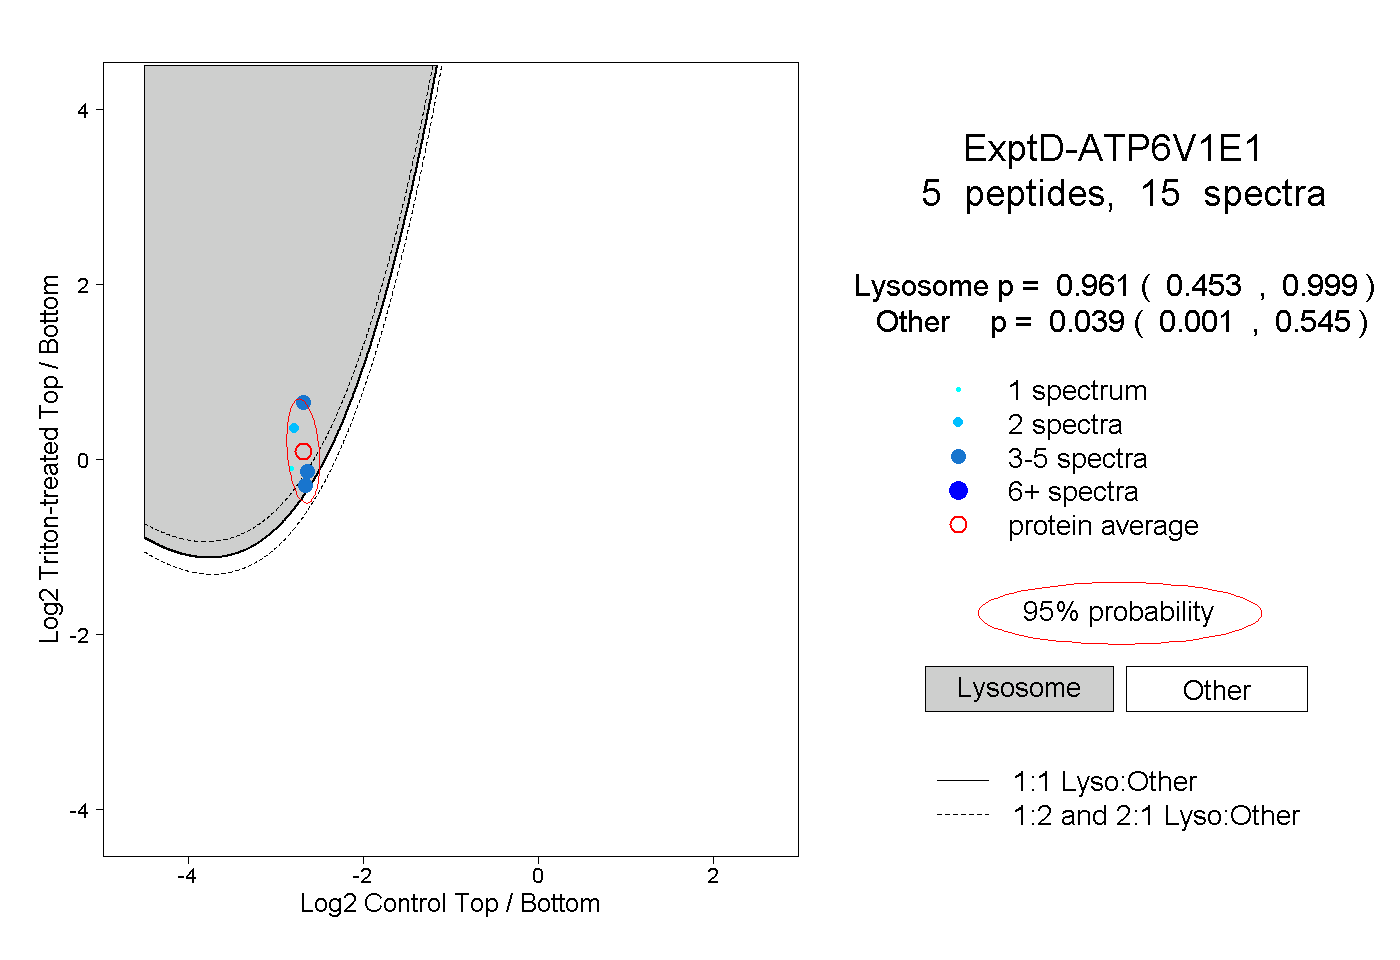
0.453 | 0.999
0.001 | 0.545