ATP6V1E1
[ENSRNOP00000016495]
Main page
| | | Plot |
Mito |
Lyso |
|
Perox |
ER |
Golgi |
PM |
Cytosol |
Nucleus |
|
| Expt A |
 10
10
peptides |
71
spectra |
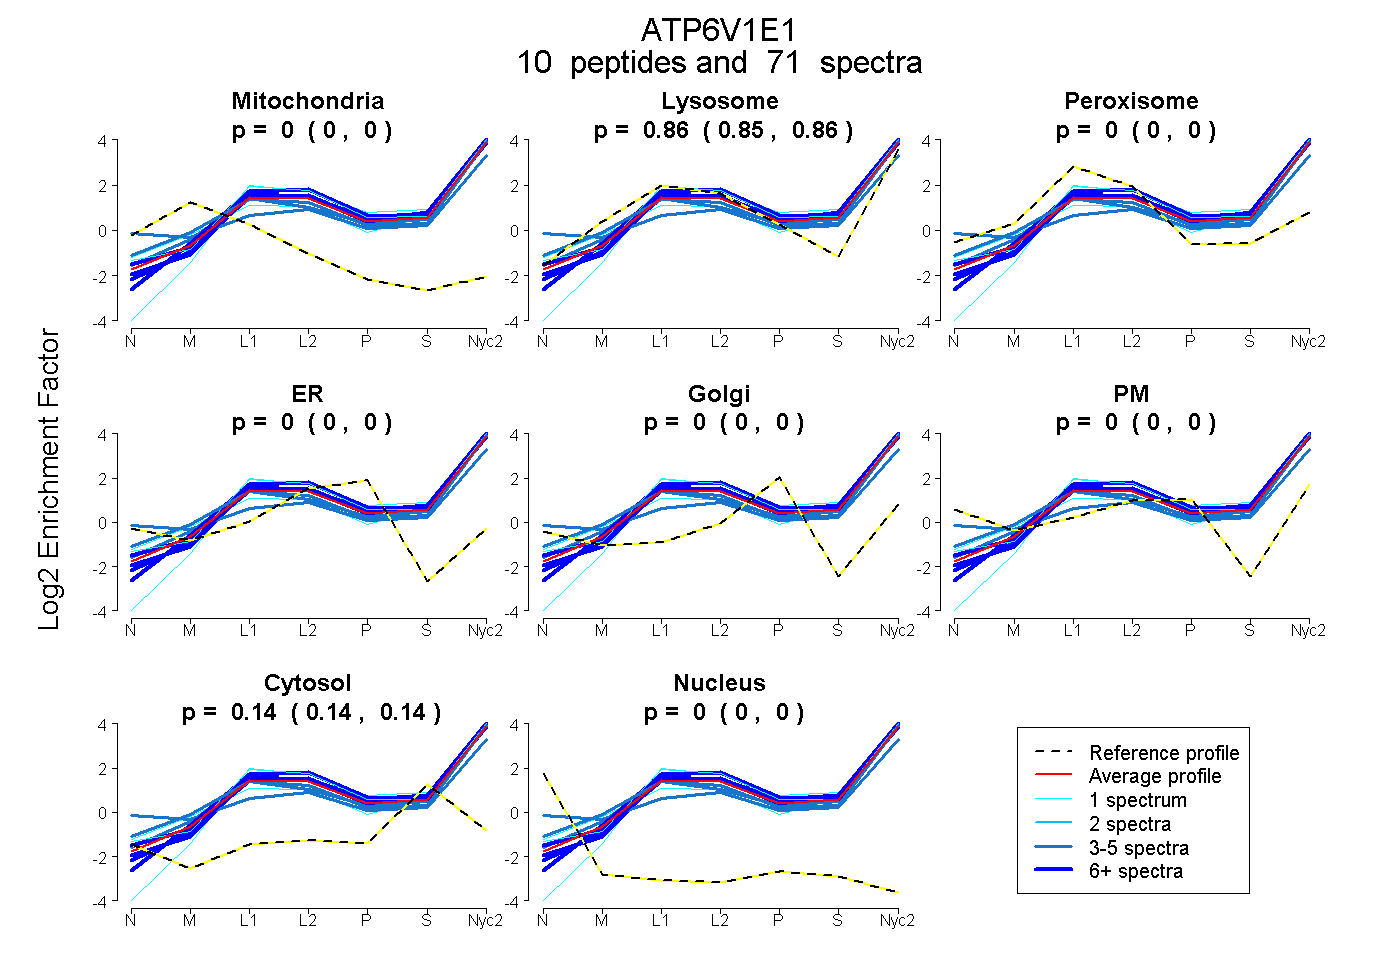 |
0.000
0.000 | 0.000 |
0.858
0.855 | 0.860 |
|
0.000
0.000 | 0.000 |
0.000
0.000 | 0.000 |
0.000
0.000 | 0.000 |
0.000
0.000 | 0.000 |
0.142
0.139 | 0.145 |
0.000
0.000 | 0.000 |
|
| | | Plot |
Mito |
|
Lyso or Perox |
|
ER |
Golgi |
PM |
Cytosol |
Nucleus |
|
| Expt B |
4
peptides |
8
spectra |
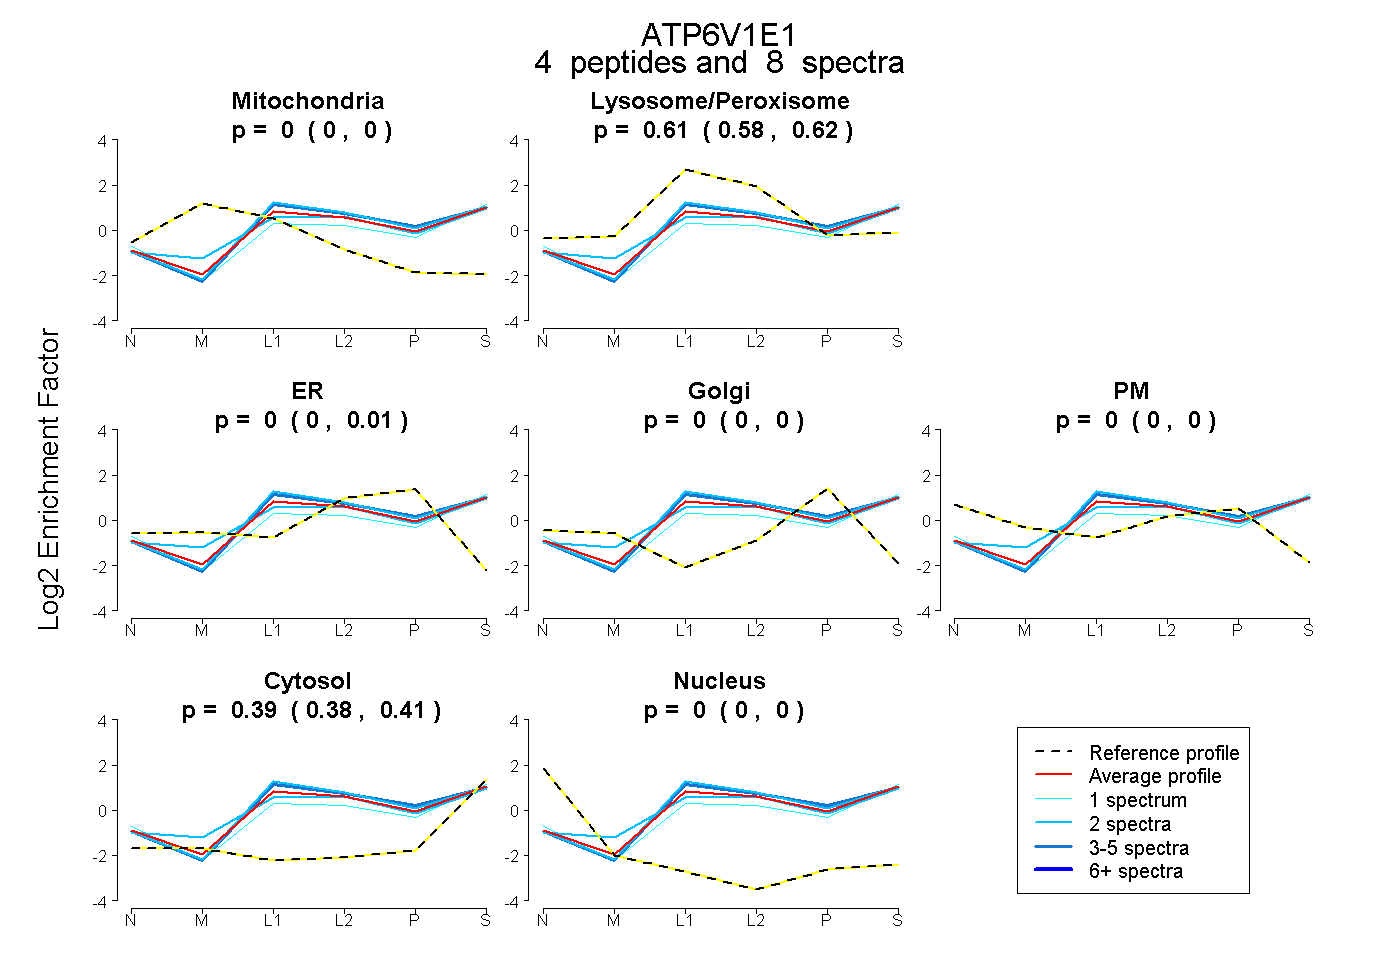 |
0.000
0.000 | 0.000 |
|
0.606
0.581 | 0.621 |
|
0.000
0.000 | 0.014 |
0.000
0.000 | 0.000 |
0.000
0.000 | 0.000 |
0.394
0.375 | 0.407 |
0.000
0.000 | 0.000 |
|
| 2 spectra, VSNTLESR |
0.000 |
|
0.578 |
|
0.031 |
0.000 |
0.000 |
0.391 |
0.000 |
|
| 2 spectra, LVQTQR |
0.000 |
|
0.661 |
|
0.000 |
0.000 |
0.000 |
0.339 |
0.000 |
|
| 1 spectrum, AEEEFNIEK |
0.000 |
|
0.508 |
|
0.000 |
0.000 |
0.000 |
0.492 |
0.000 |
|
| 3 spectra, GALFGANANR |
0.000 |
|
0.652 |
|
0.000 |
0.000 |
0.000 |
0.348 |
0.000 |
|
| | | Plot |
|
Lyso |
|
|
|
|
|
|
|
Other |
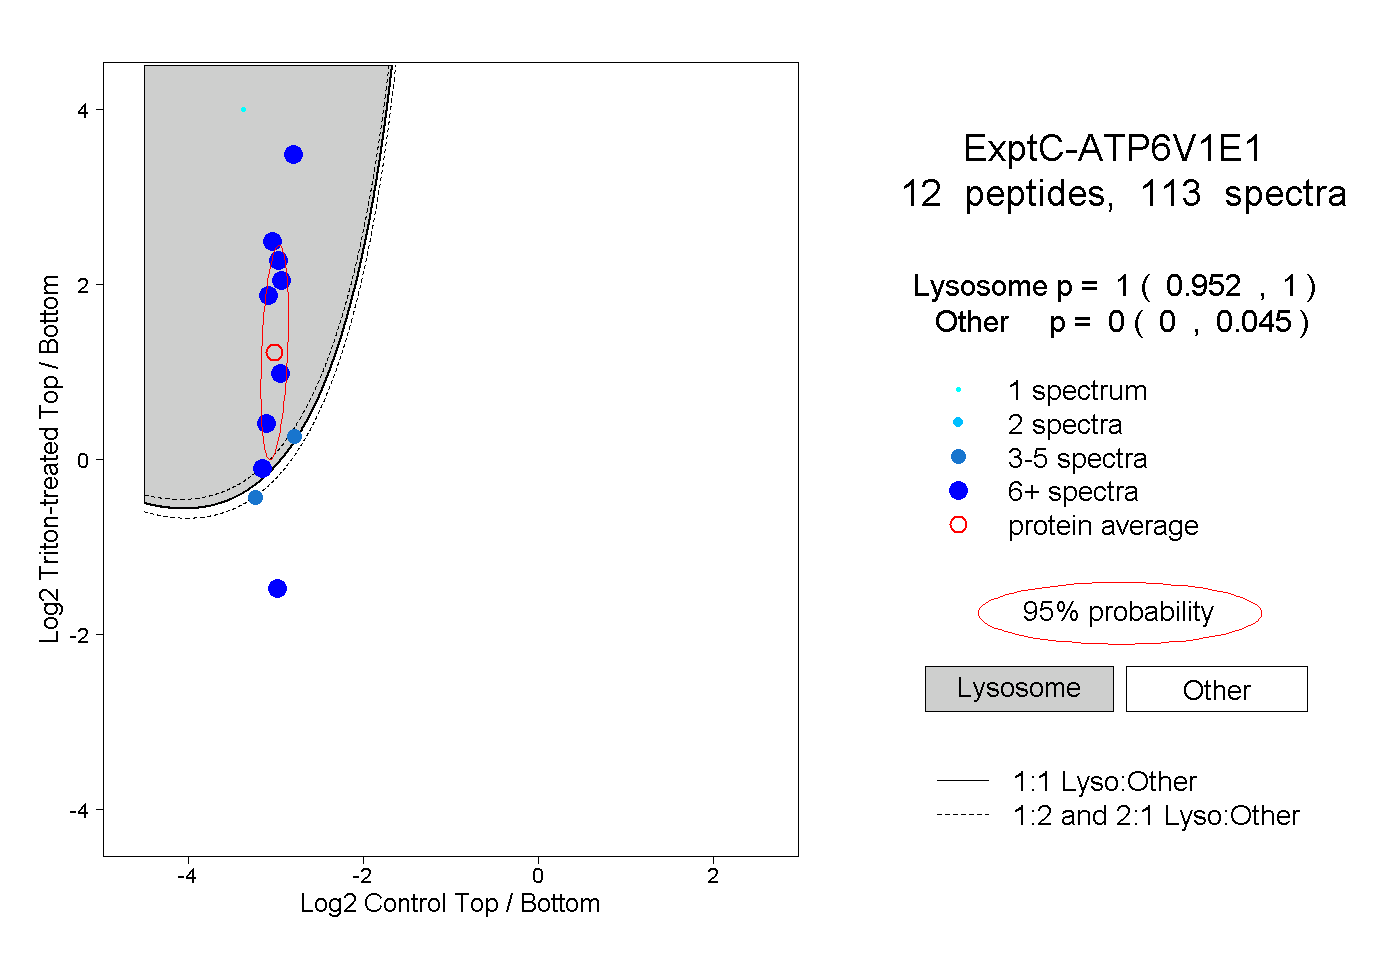
| Expt C |
12
peptides |
113
spectra |
 |
|
1.000
0.952 | 1.000 |
|
|
|
|
|
|
|
0.000
0.000 | 0.045 |
| | | Plot |
|
Lyso |
|
|
|
|
|
|
|
Other |
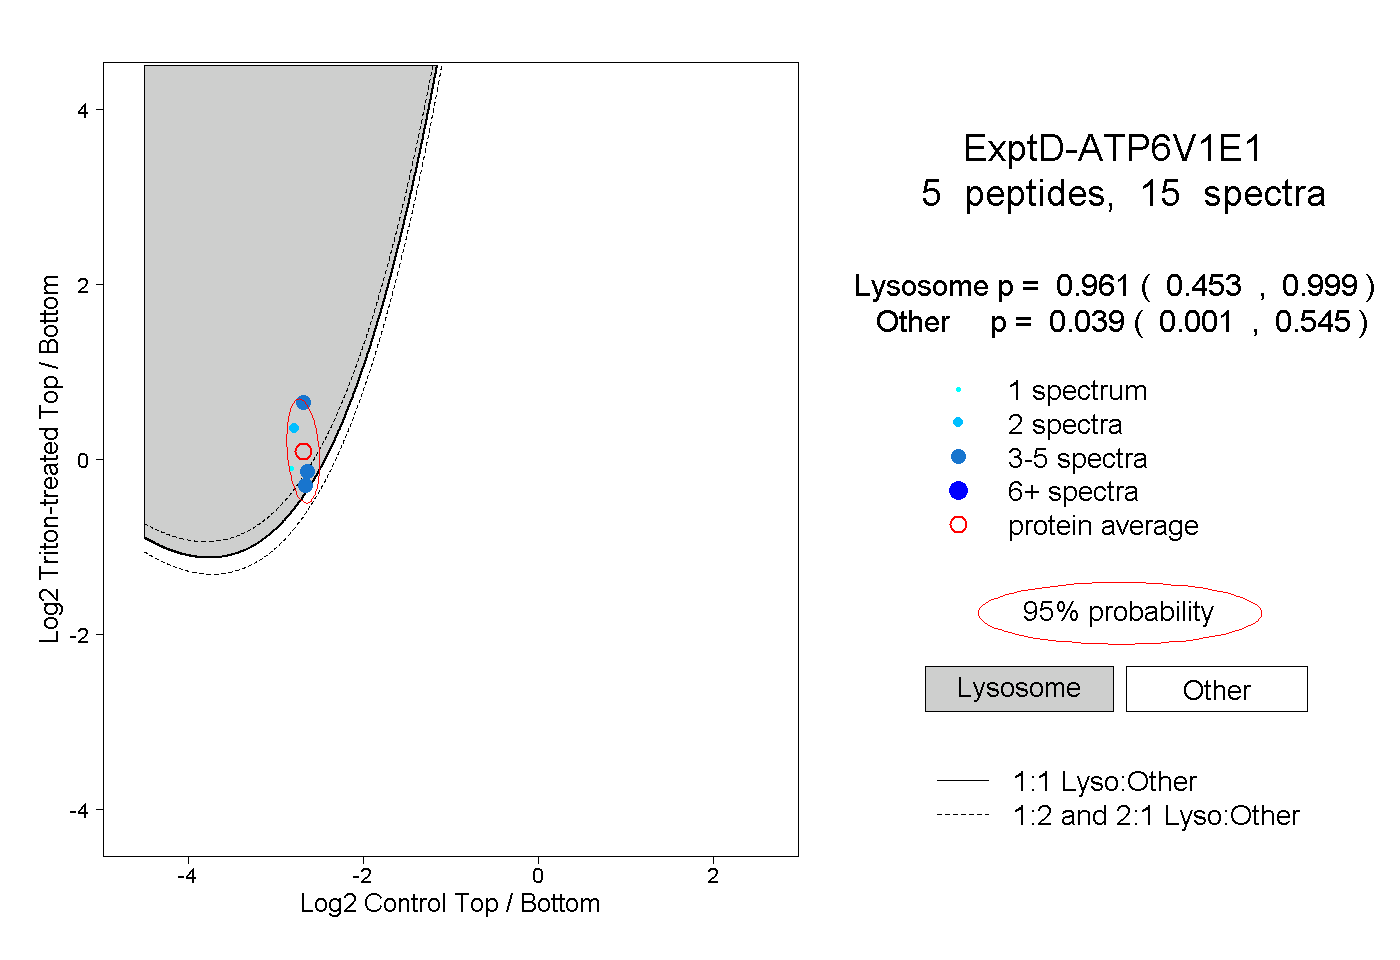
| Expt D |
5
peptides |
15
spectra |
 |
|
0.961
0.453 | 0.999 |
|
|
|
|
|
|
|
0.039
0.001 | 0.545 |