 13
13peptides
spectra
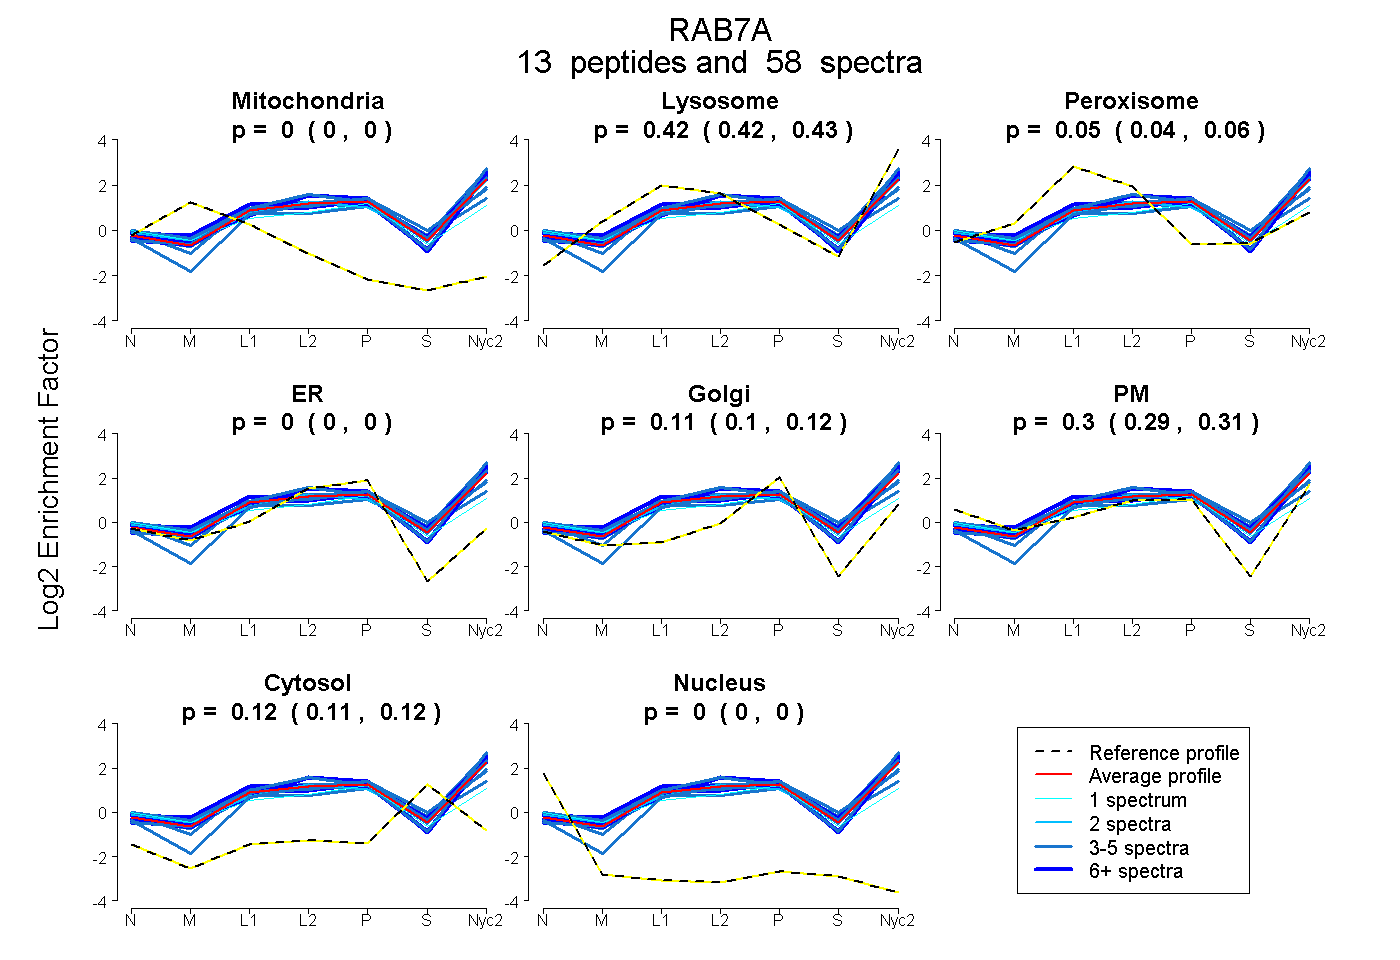
0.000 | 0.000
0.415 | 0.432
0.038 | 0.058
0.000 | 0.000
0.102 | 0.121
0.287 | 0.308
0.112 | 0.118
0.000 | 0.000
10peptides
spectra

0.000 | 0.000
0.592 | 0.602
0.000 | 0.000
0.344 | 0.357
0.000 | 0.000
0.045 | 0.056
0.000 | 0.000
15peptides
spectra
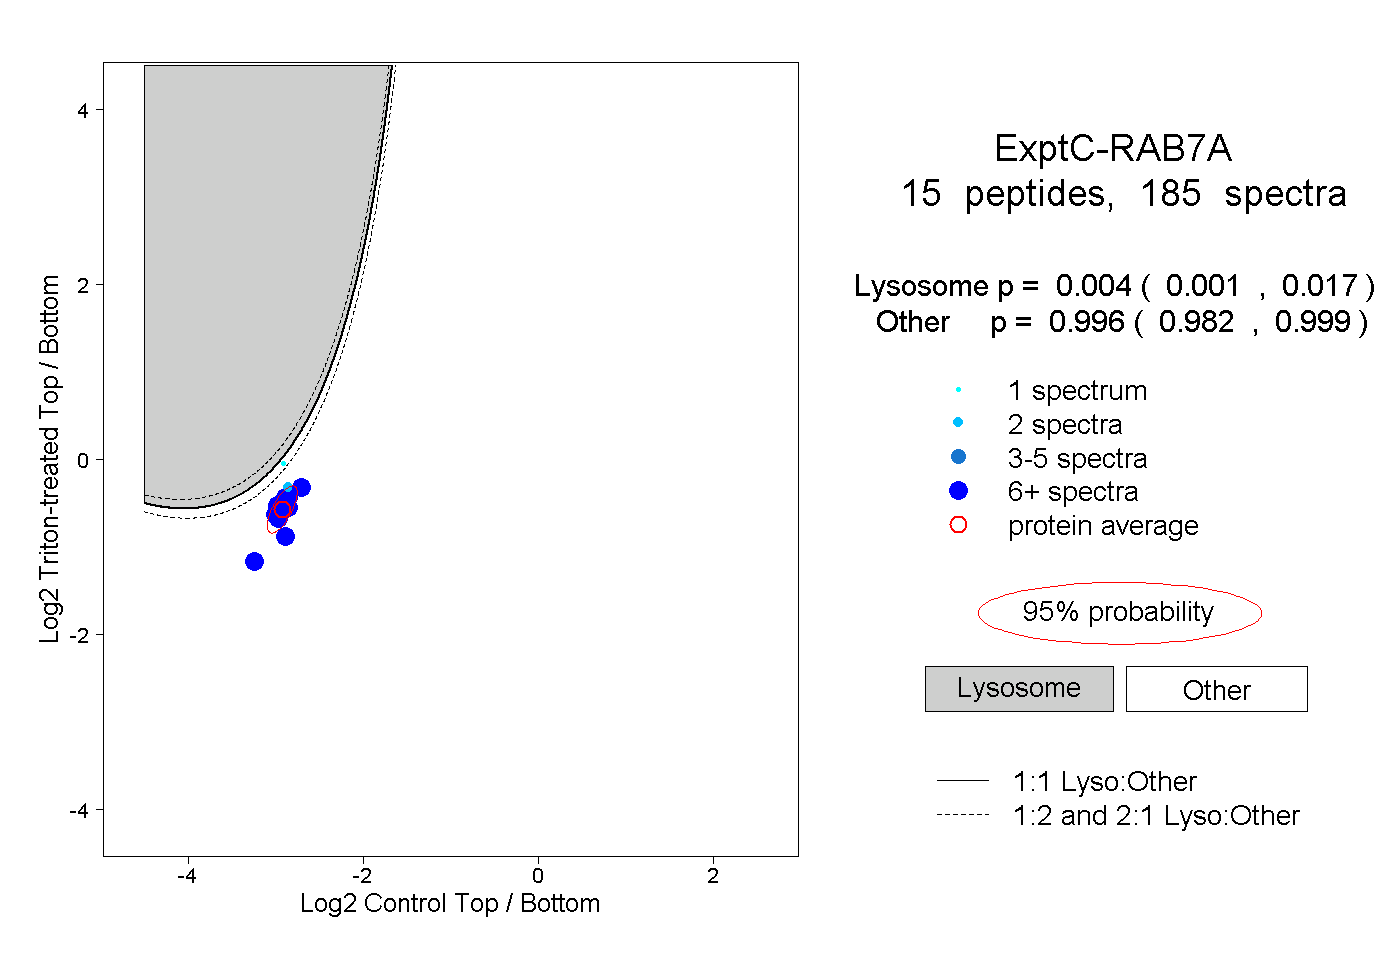
0.001 | 0.017
0.982 | 0.999
6peptides
spectra
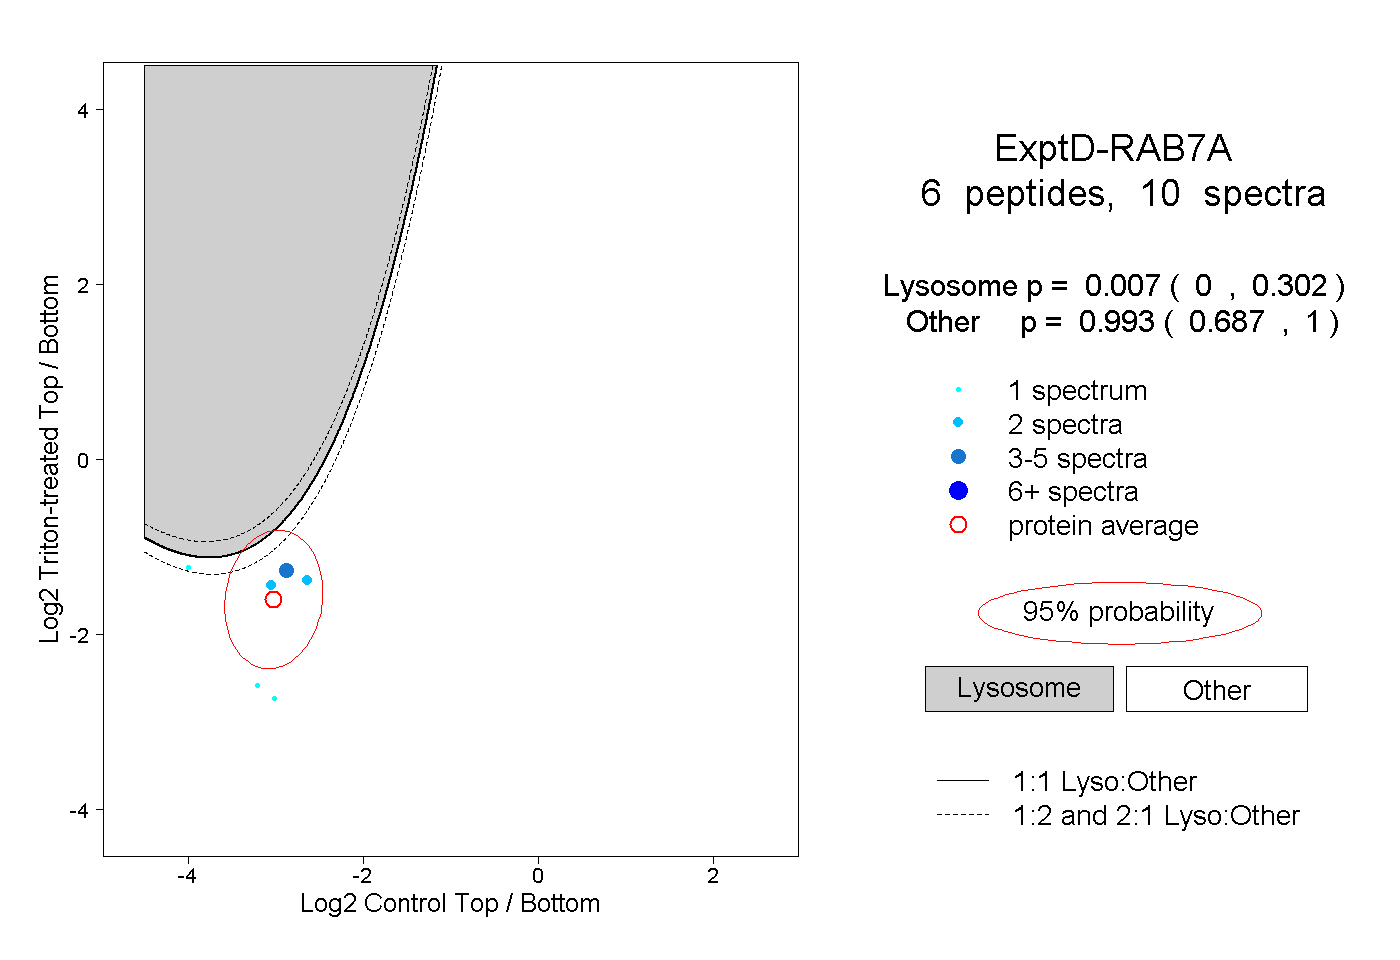
0.000 | 0.302
0.687 | 1.000