 9
9peptides
spectra
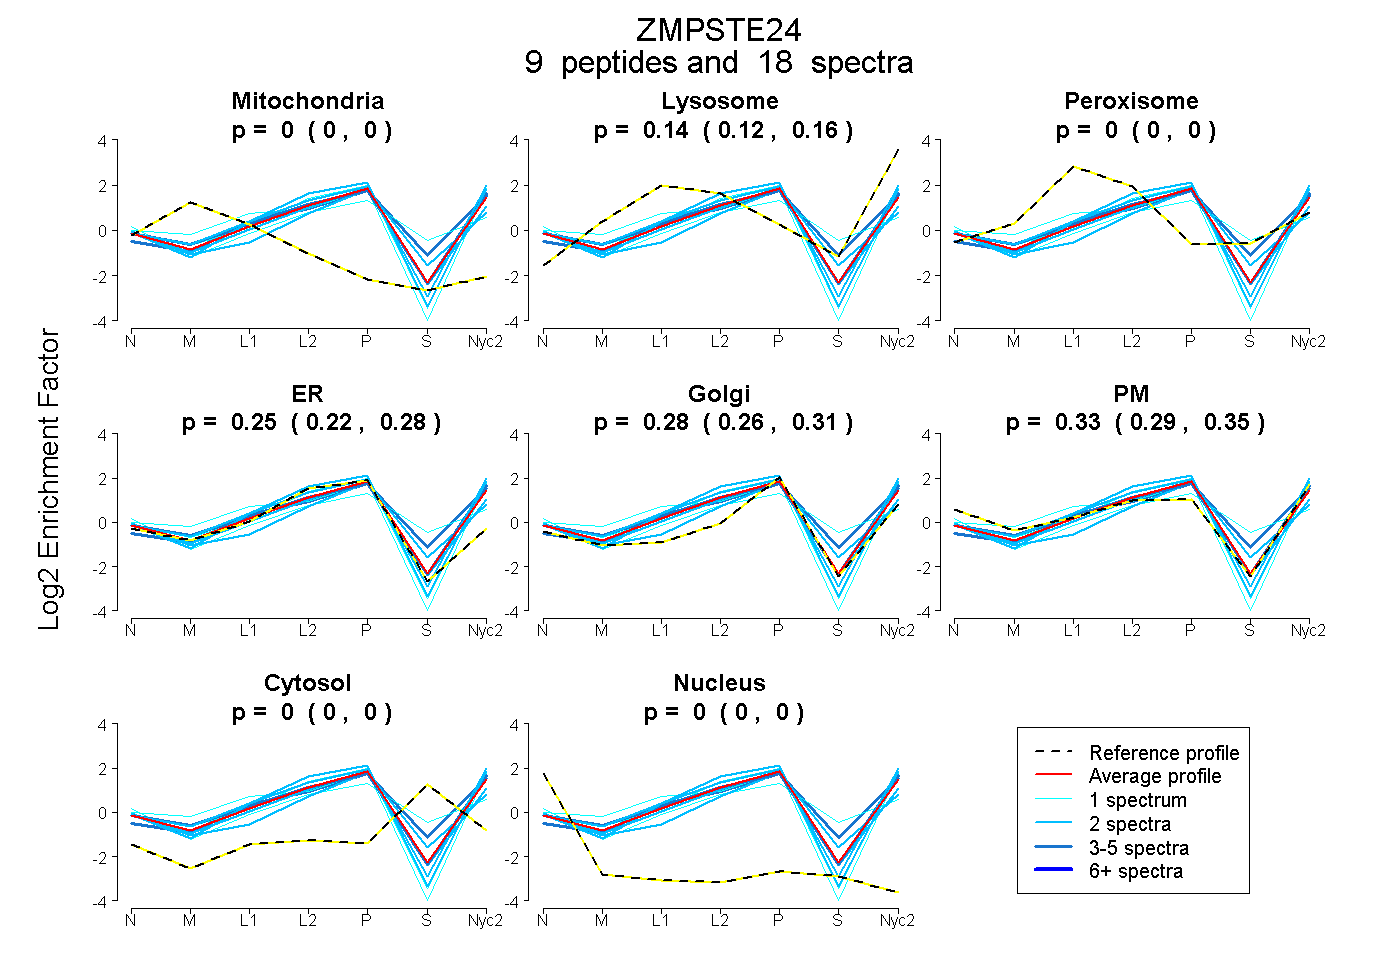
0.000 | 0.000
0.124 | 0.161
0.000 | 0.000
0.215 | 0.276
0.257 | 0.307
0.290 | 0.354
0.000 | 0.000
0.000 | 0.000
5peptides
spectra
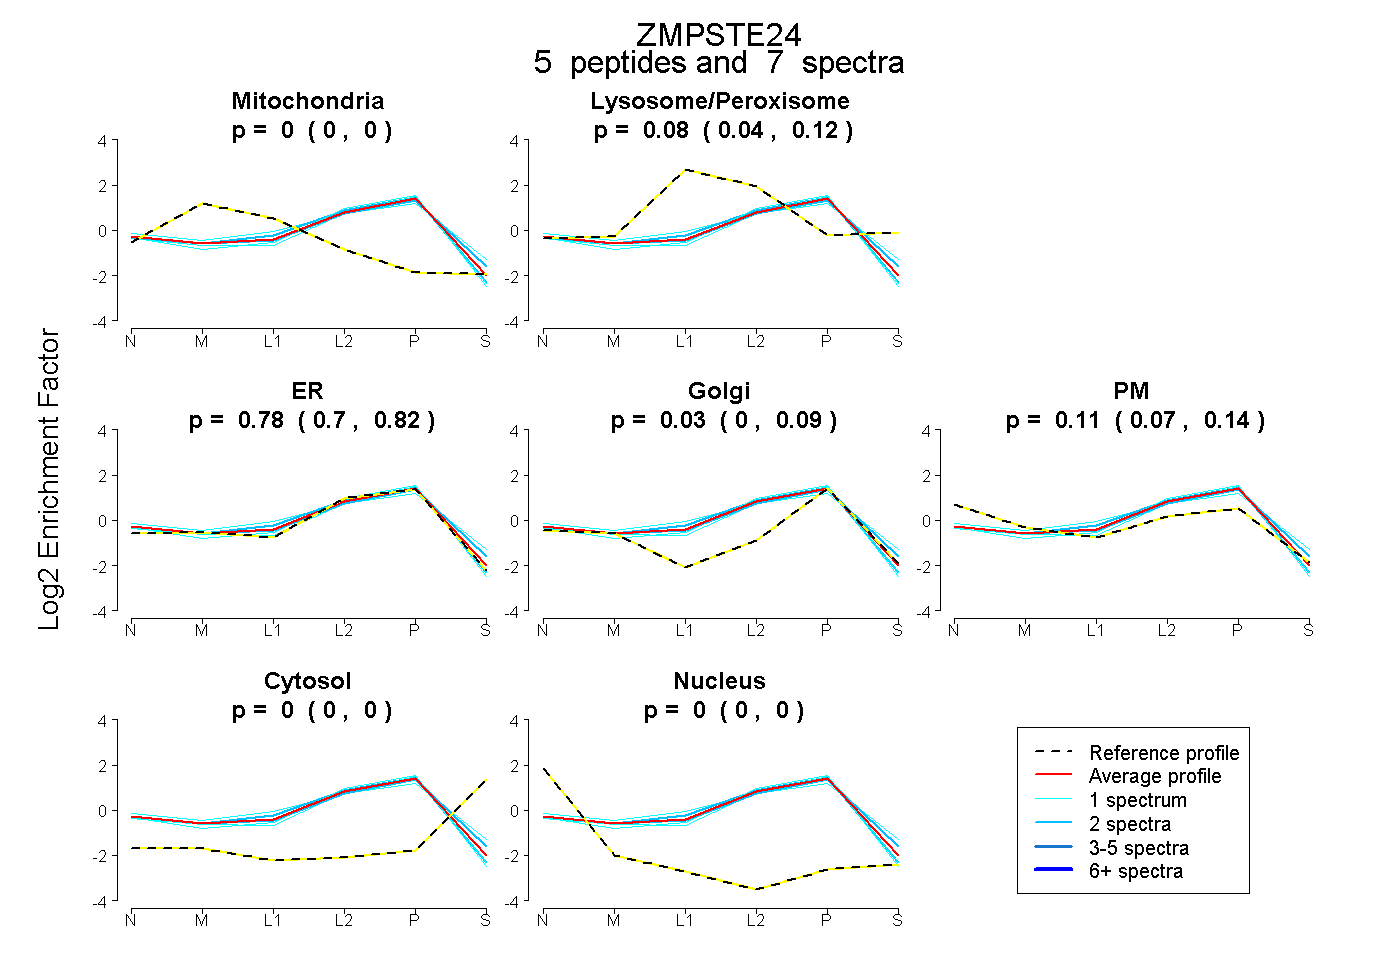
0.000 | 0.000
0.044 | 0.115
0.701 | 0.824
0.000 | 0.094
0.065 | 0.139
0.000 | 0.000
0.000 | 0.000
10peptides
spectra
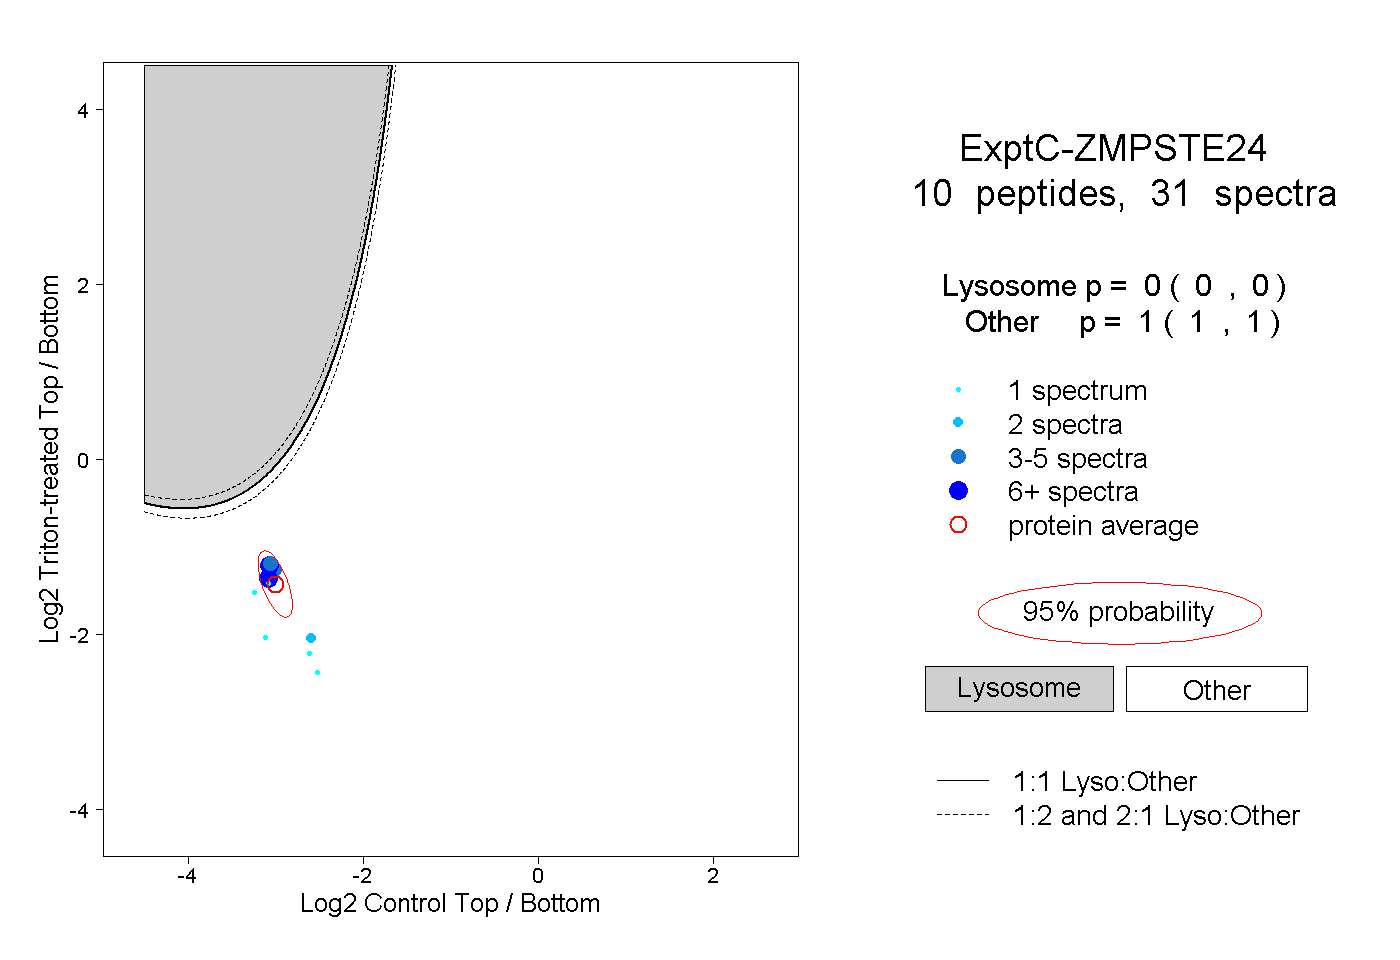
0.000 | 0.000
1.000 | 1.000
5peptides
spectra
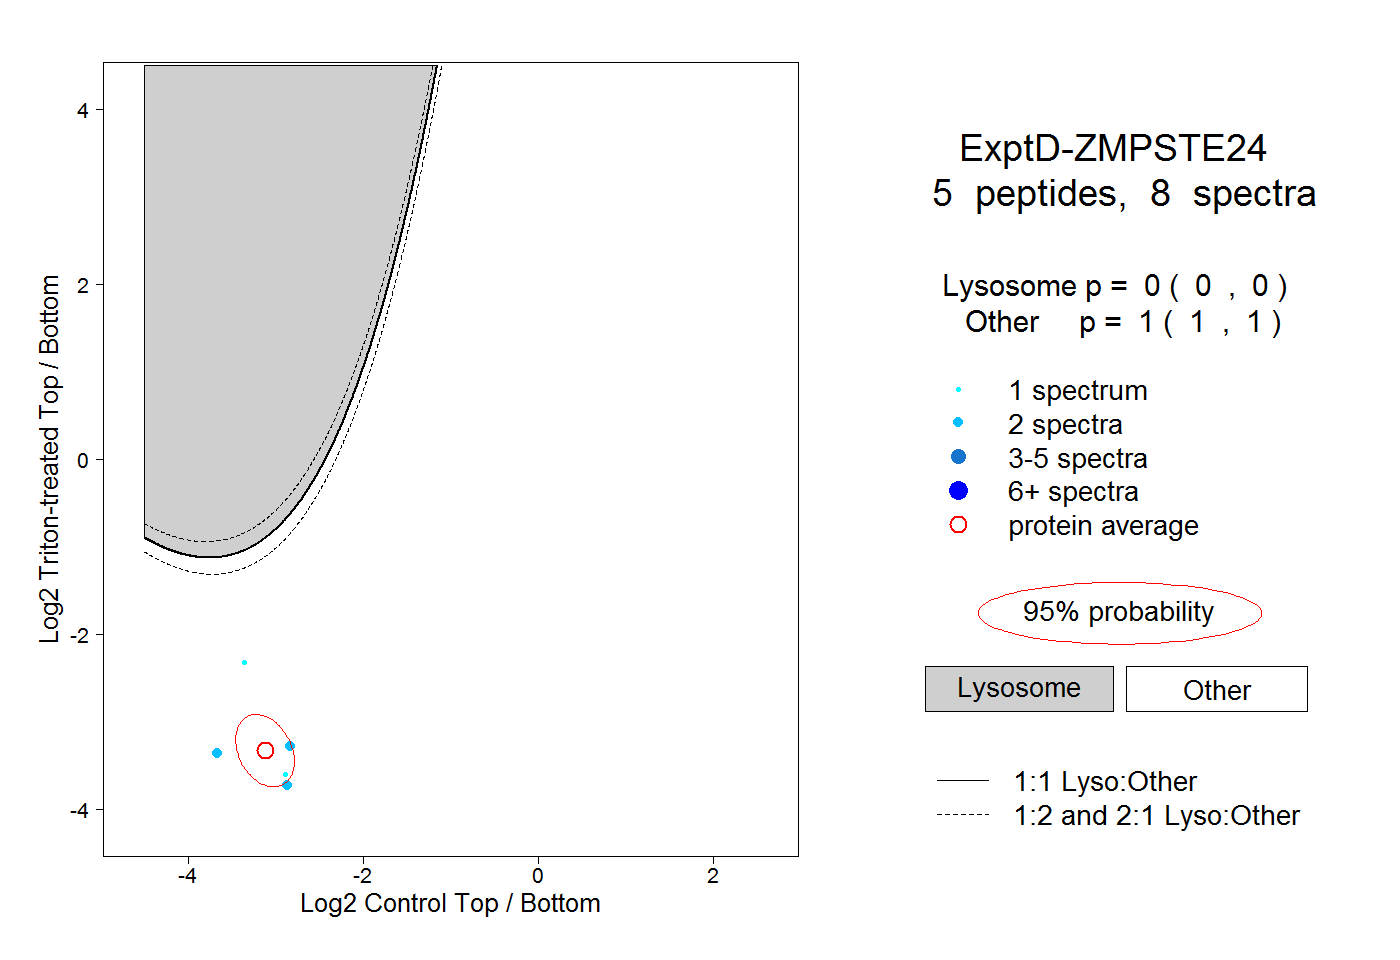
0.000 | 0.000
1.000 | 1.000