ZMPSTE24
[ENSRNOP00000016410]
Main page
| | | Plot |
Mito |
Lyso |
|
Perox |
ER |
Golgi |
PM |
Cytosol |
Nucleus |
|
| Expt A |
 9
9
peptides |
18
spectra |
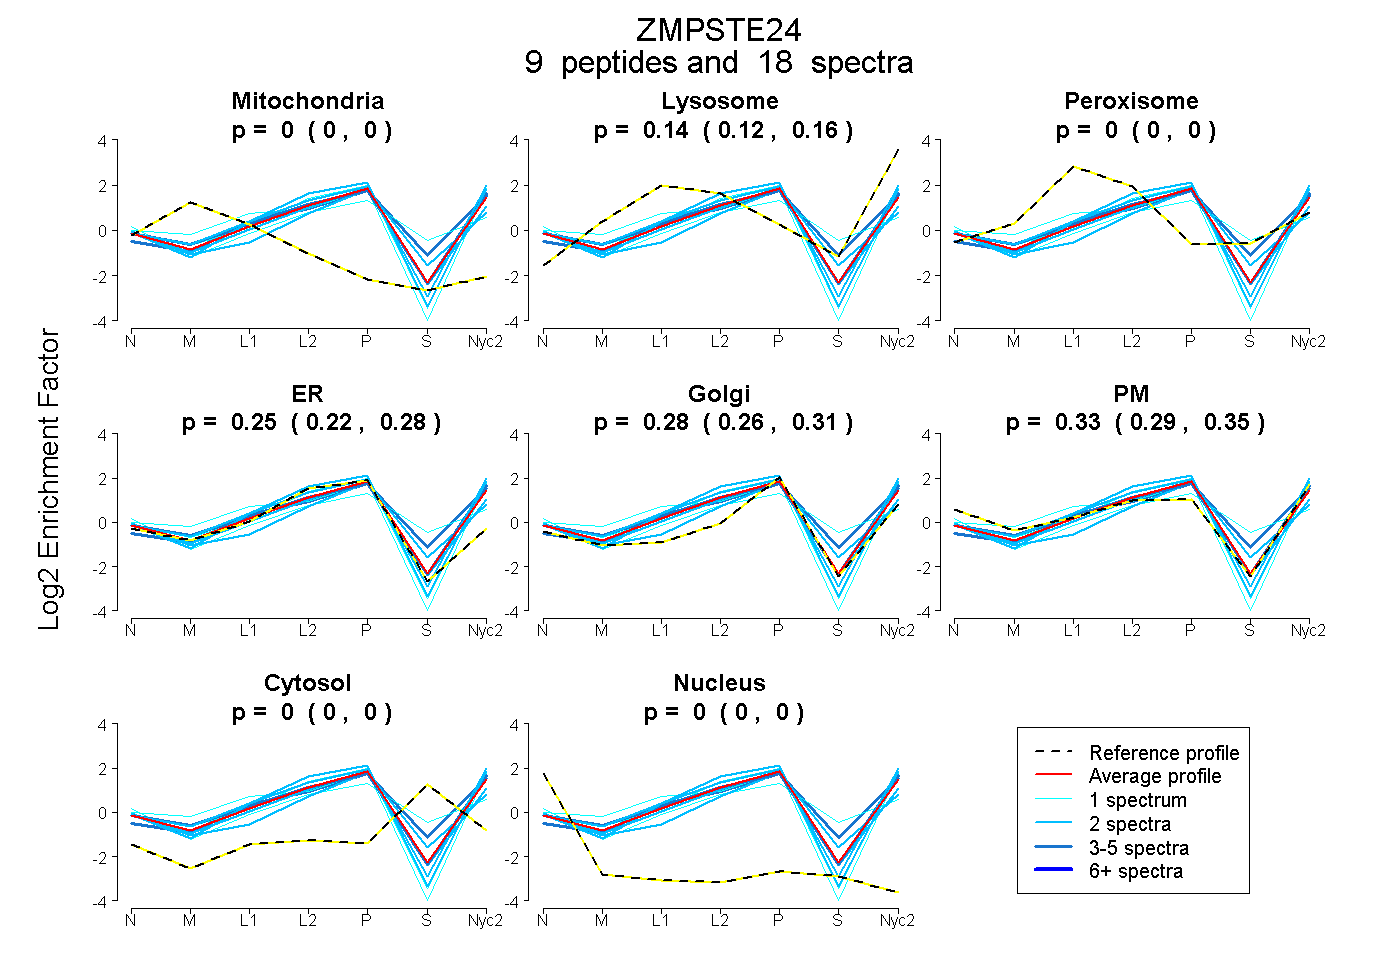 |
0.000
0.000 | 0.000 |
0.143
0.124 | 0.161 |
|
0.000
0.000 | 0.000 |
0.247
0.215 | 0.276 |
0.285
0.257 | 0.307 |
0.325
0.290 | 0.354 |
0.000
0.000 | 0.000 |
0.000
0.000 | 0.000 |
|
| | | Plot |
Mito |
|
Lyso or Perox |
|
ER |
Golgi |
PM |
Cytosol |
Nucleus |
|
| Expt B |
5
peptides |
7
spectra |
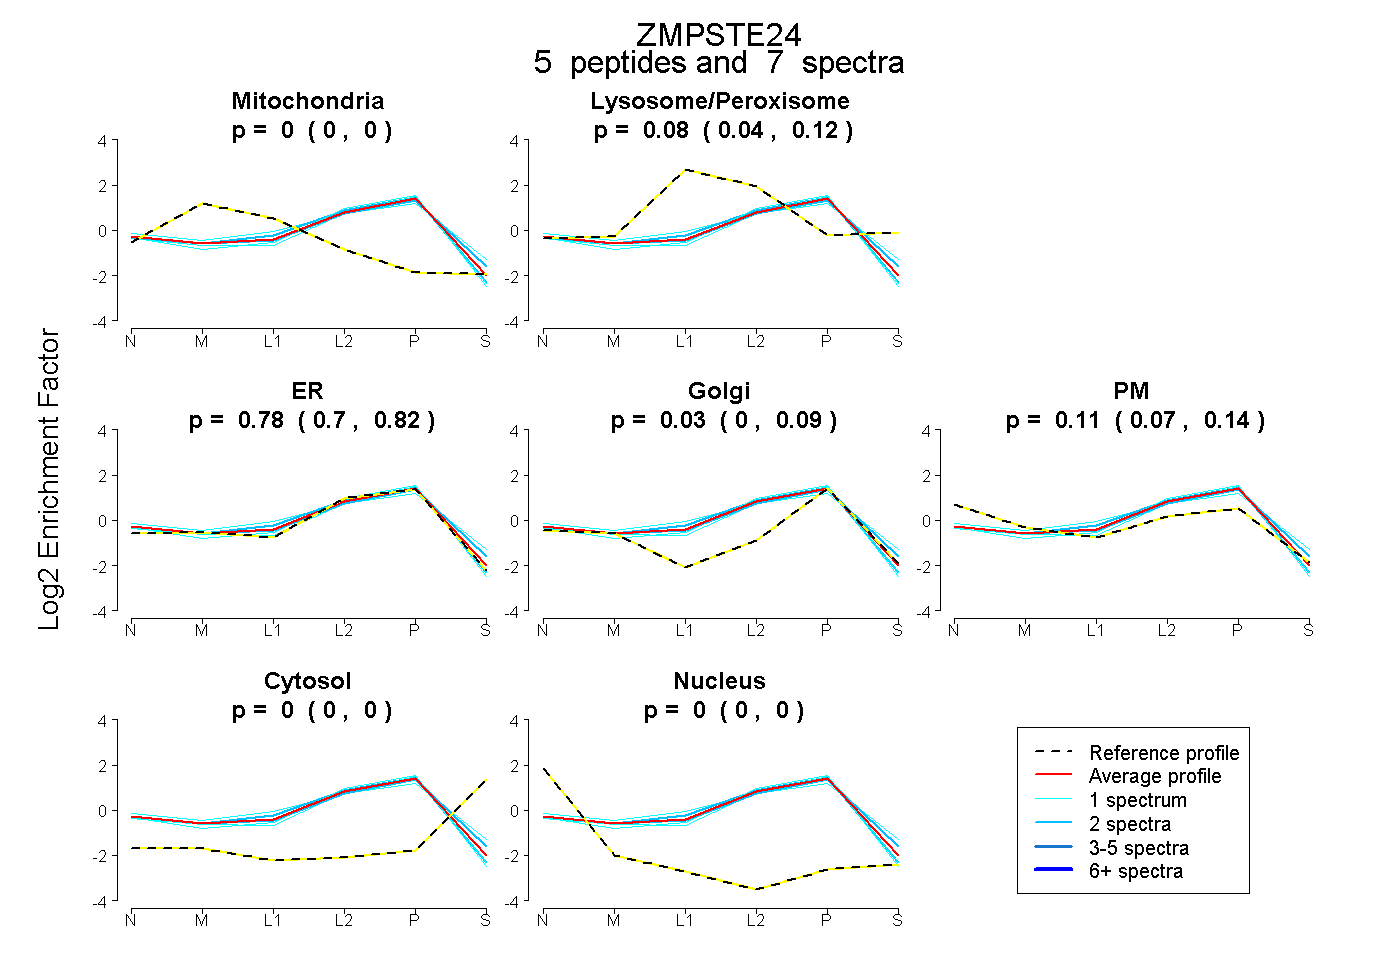 |
0.000
0.000 | 0.000 |
|
0.078
0.044 | 0.115 |
|
0.775
0.701 | 0.824 |
0.033
0.000 | 0.094 |
0.113
0.065 | 0.139 |
0.000
0.000 | 0.000 |
0.000
0.000 | 0.000 |
|
| 1 spectrum, SIDFPLTK |
0.000 |
|
0.000 |
|
0.898 |
0.031 |
0.071 |
0.000 |
0.000 |
|
| 2 spectra, LGHTVK |
0.000 |
|
0.069 |
|
0.855 |
0.000 |
0.076 |
0.000 |
0.000 |
|
| 1 spectrum, DLYSALIK |
0.000 |
|
0.293 |
|
0.348 |
0.255 |
0.105 |
0.000 |
0.000 |
|
| 1 spectrum, LYQLDK |
0.000 |
|
0.000 |
|
0.991 |
0.000 |
0.009 |
0.000 |
0.000 |
|
| 2 spectra, VYVVEGSK |
0.000 |
|
0.175 |
|
0.556 |
0.233 |
0.036 |
0.000 |
0.000 |
|
| | | Plot |
|
Lyso |
|
|
|
|
|
|
|
Other |
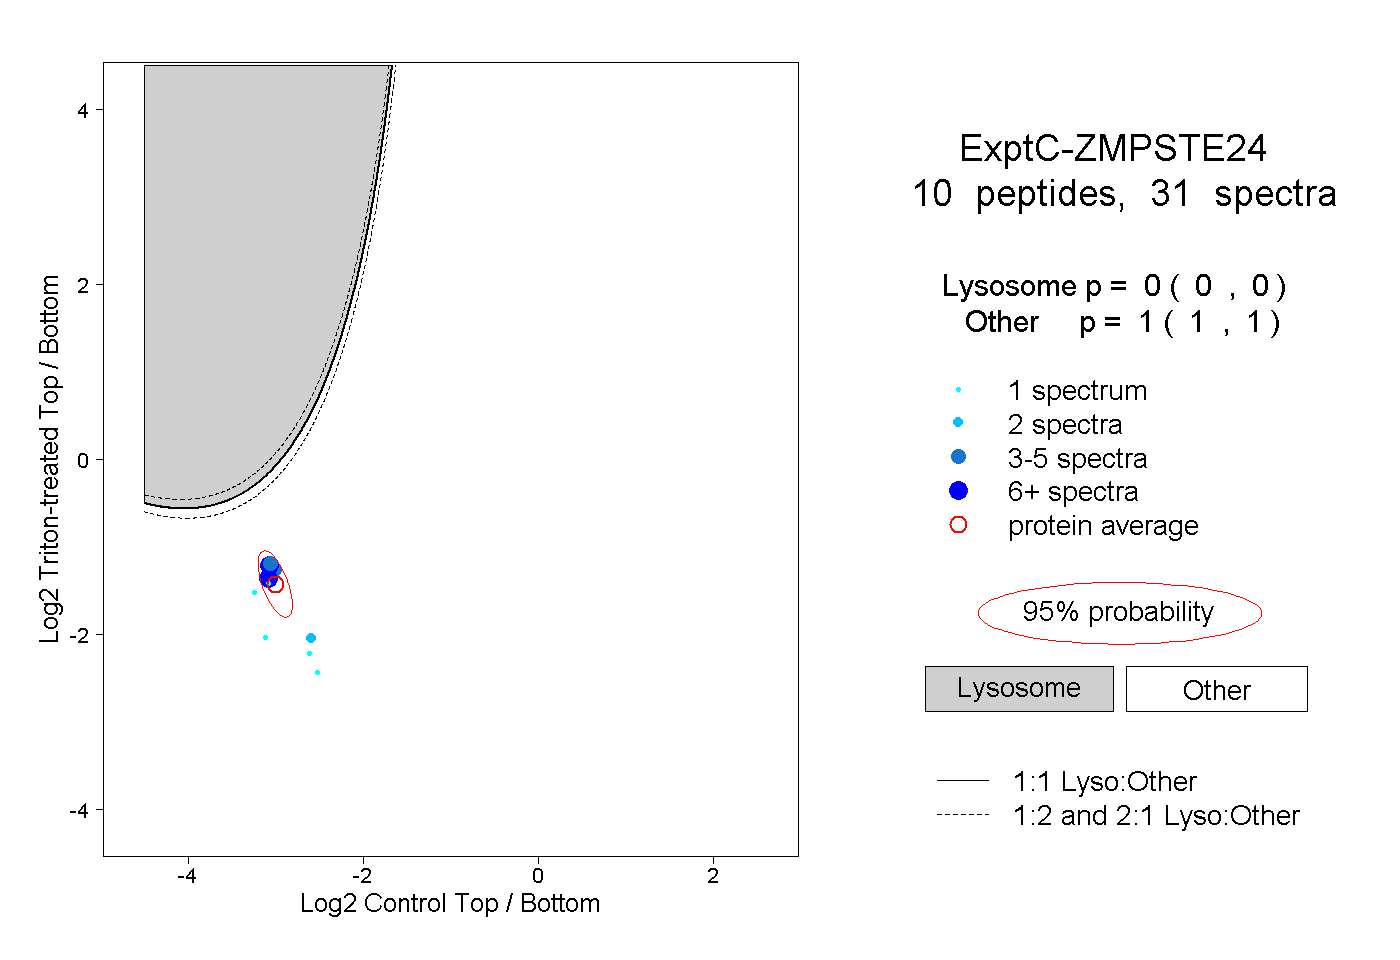
| Expt C |
10
peptides |
31
spectra |
 |
|
0.000
0.000 | 0.000 |
|
|
|
|
|
|
|
1.000
1.000 | 1.000 |
| | | Plot |
|
Lyso |
|
|
|
|
|
|
|
Other |
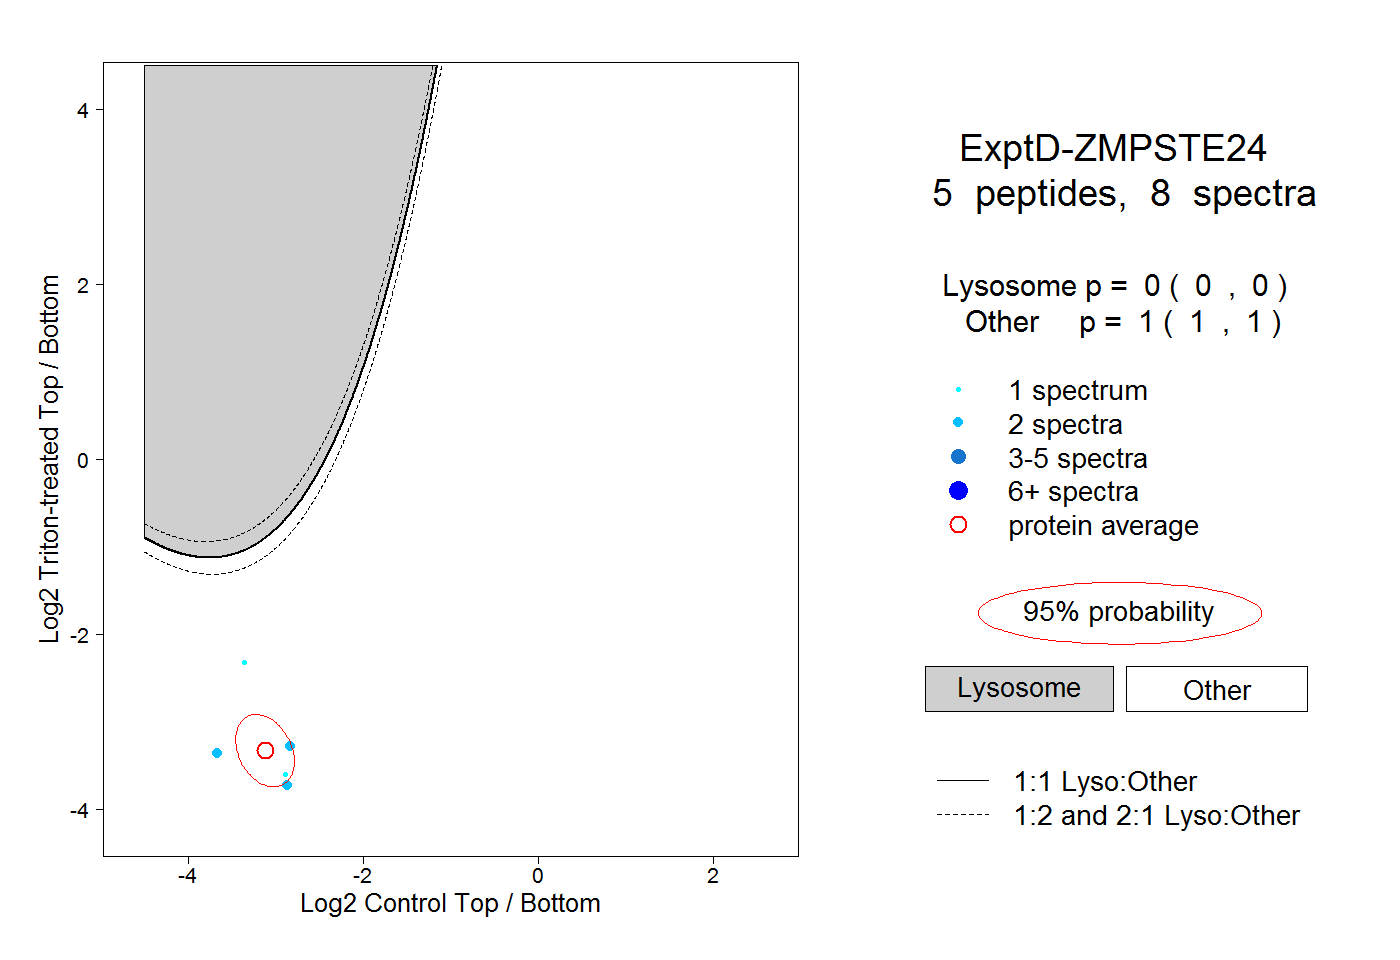
| Expt D |
5
peptides |
8
spectra |
 |
|
0.000
0.000 | 0.000 |
|
|
|
|
|
|
|
1.000
1.000 | 1.000 |