 9
9peptides
spectra
0.000 | 0.000
0.124 | 0.161
0.000 | 0.000
0.215 | 0.276
0.257 | 0.307
0.290 | 0.354
0.000 | 0.000
0.000 | 0.000
| Plot | Mito | Lyso | Perox | ER | Golgi | PM | Cytosol | Nucleus | |||||
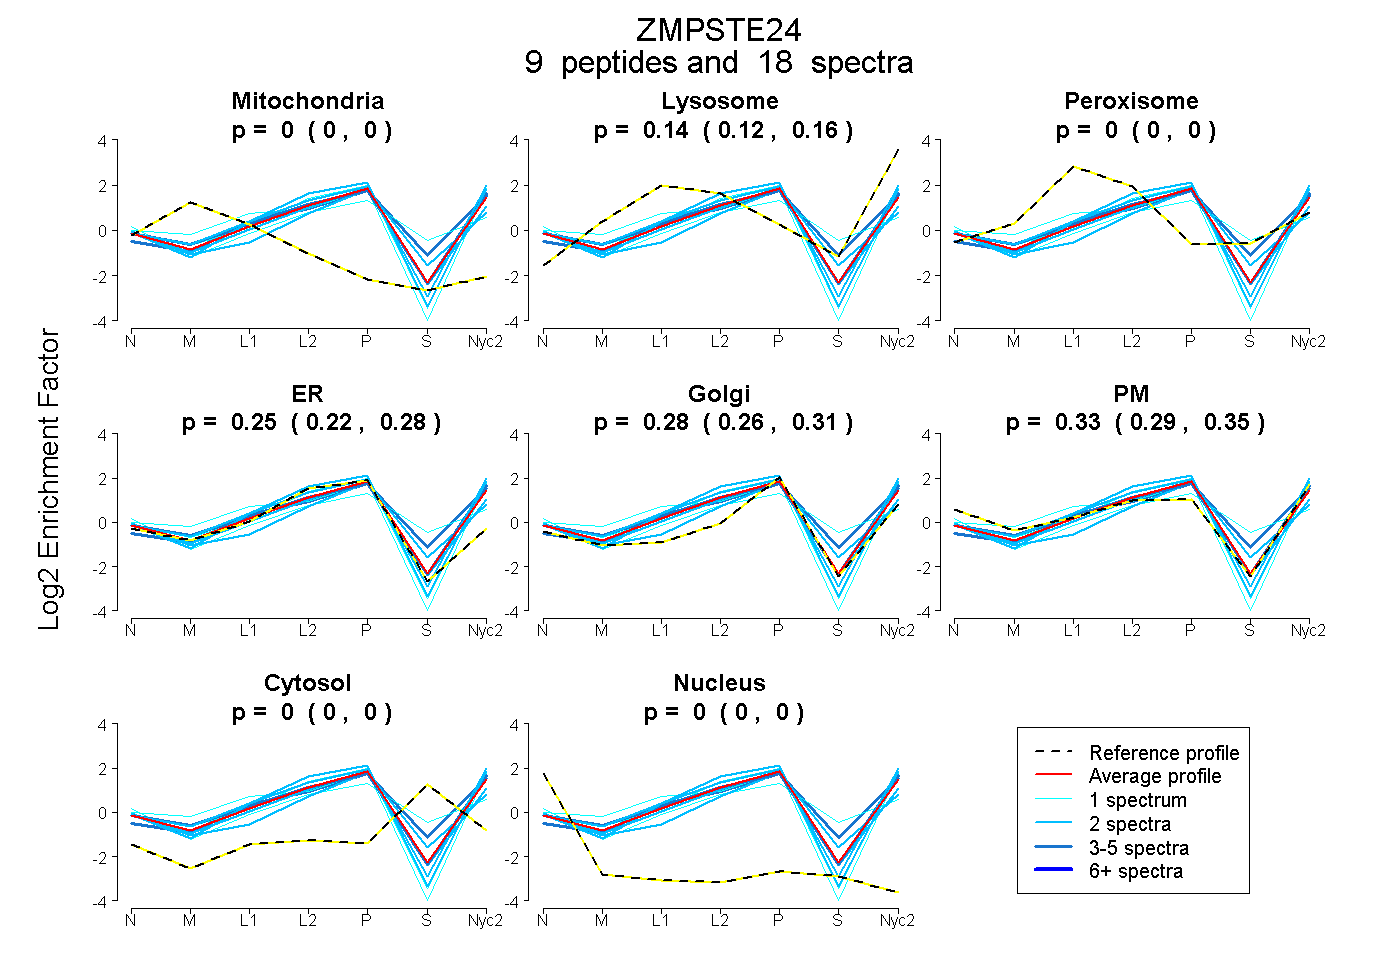
| Expt A |
9 peptides |
18 spectra |
|
0.000 0.000 | 0.000 |
0.143 0.124 | 0.161 |
0.000 0.000 | 0.000 |
0.247 0.215 | 0.276 |
0.285 0.257 | 0.307 |
0.325 0.290 | 0.354 |
0.000 0.000 | 0.000 |
0.000 0.000 | 0.000 |
| 4 spectra, SIDFPLTK | 0.000 | 0.168 | 0.000 | 0.202 | 0.236 | 0.394 | 0.000 | 0.000 | ||
| 1 spectrum, LYQLDK | 0.000 | 0.050 | 0.000 | 0.235 | 0.121 | 0.595 | 0.000 | 0.000 | ||
| 1 spectrum, FTPLPEGK | 0.000 | 0.028 | 0.000 | 0.197 | 0.000 | 0.775 | 0.000 | 0.000 | ||
| 1 spectrum, DNQEEPGLEPR | 0.000 | 0.000 | 0.074 | 0.236 | 0.064 | 0.362 | 0.264 | 0.000 | ||
| 2 spectra, LGHTVK | 0.000 | 0.069 | 0.000 | 0.342 | 0.313 | 0.276 | 0.000 | 0.000 | ||
| 3 spectra, DLYSALIK | 0.000 | 0.336 | 0.002 | 0.203 | 0.390 | 0.000 | 0.069 | 0.000 | ||
| 2 spectra, NEEVLAVLGHELGHWK | 0.000 | 0.027 | 0.000 | 0.228 | 0.432 | 0.216 | 0.097 | 0.000 | ||
| 2 spectra, TTTHVPPELEQIMDSDTFEK | 0.000 | 0.069 | 0.000 | 0.359 | 0.052 | 0.519 | 0.000 | 0.000 | ||
| 2 spectra, VYVVEGSK | 0.000 | 0.155 | 0.000 | 0.200 | 0.146 | 0.499 | 0.000 | 0.000 |
| Plot | Mito | Lyso or Perox | ER | Golgi | PM | Cytosol | Nucleus | ||||||
| Expt B |
5 peptides |
7 spectra |
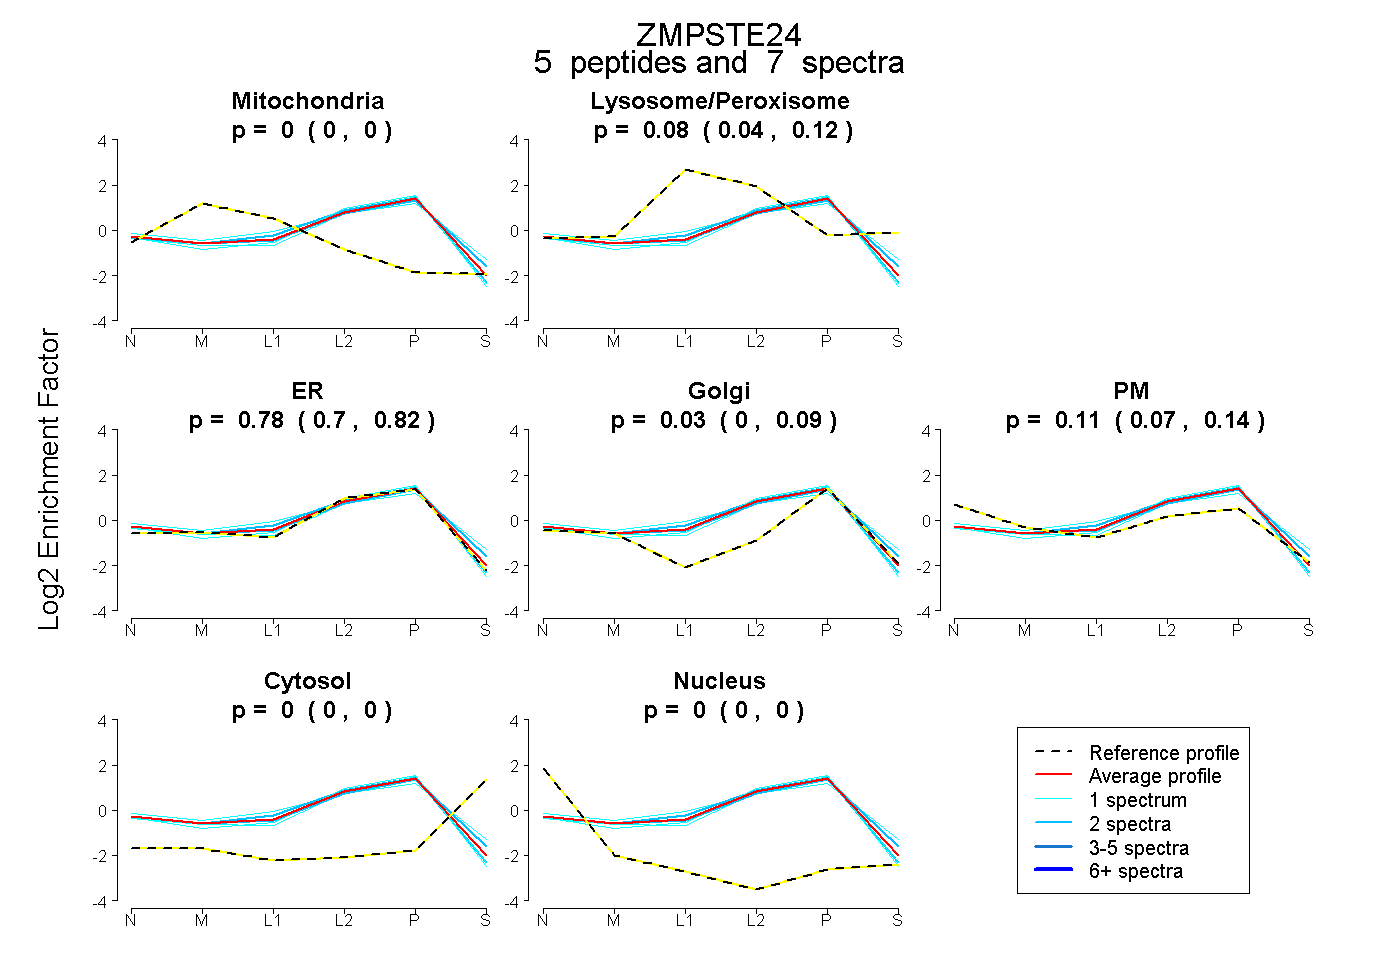 |
0.000 0.000 | 0.000 |
0.078 0.044 | 0.115 |
0.775 0.701 | 0.824 |
0.033 0.000 | 0.094 |
0.113 0.065 | 0.139 |
0.000 0.000 | 0.000 |
0.000 0.000 | 0.000 |
|||
| Plot | Lyso | Other | |||||||||||
| Expt C |
10 peptides |
31 spectra |
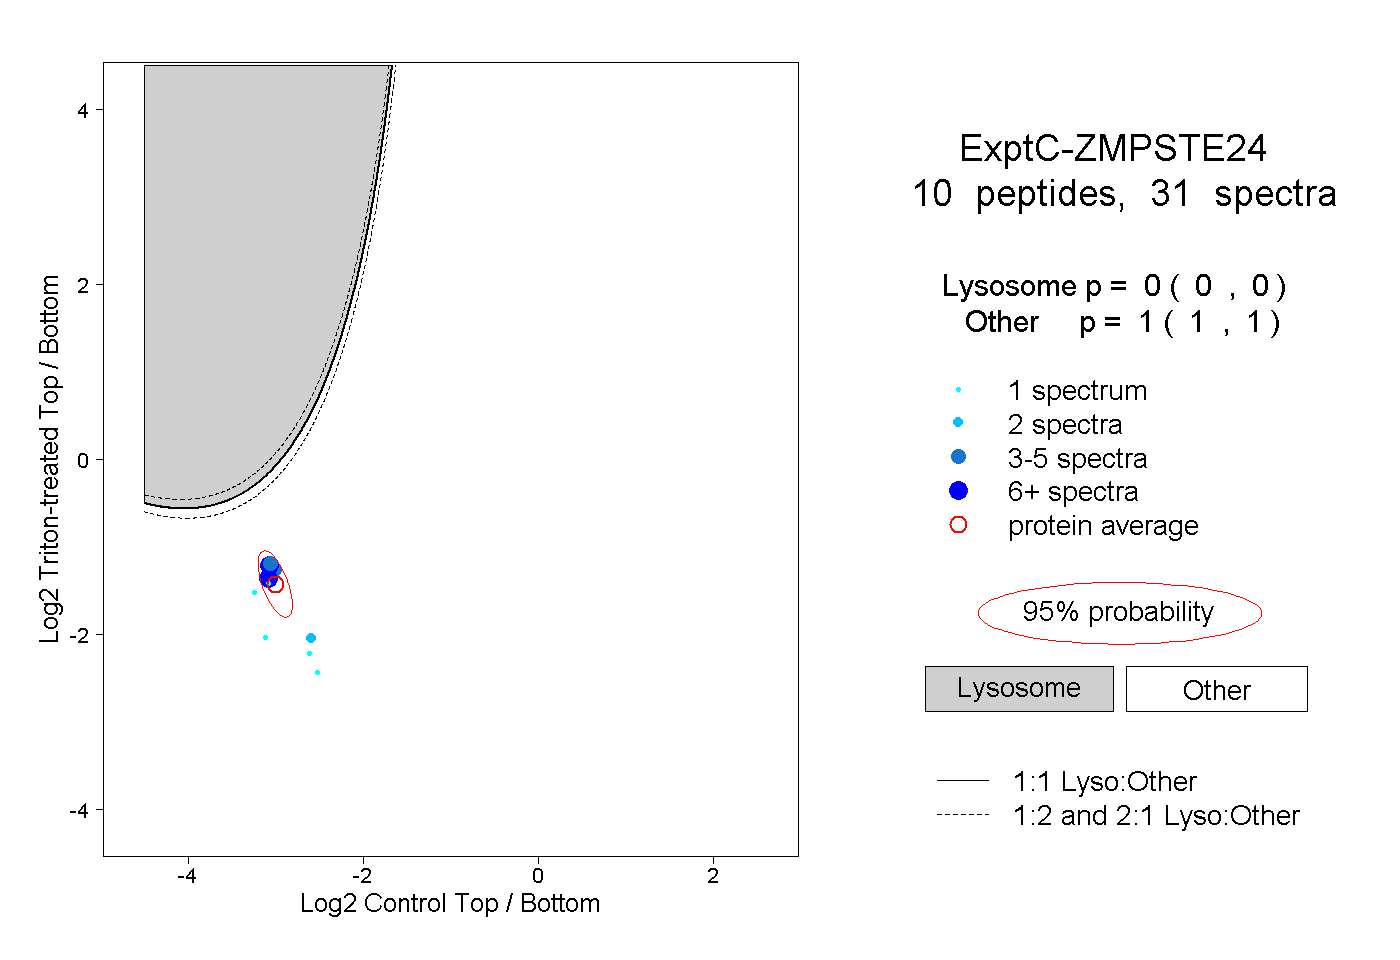 |
0.000 0.000 | 0.000 |
1.000 1.000 | 1.000 |
||||||||
| Plot | Lyso | Other | |||||||||||
| Expt D |
5 peptides |
8 spectra |
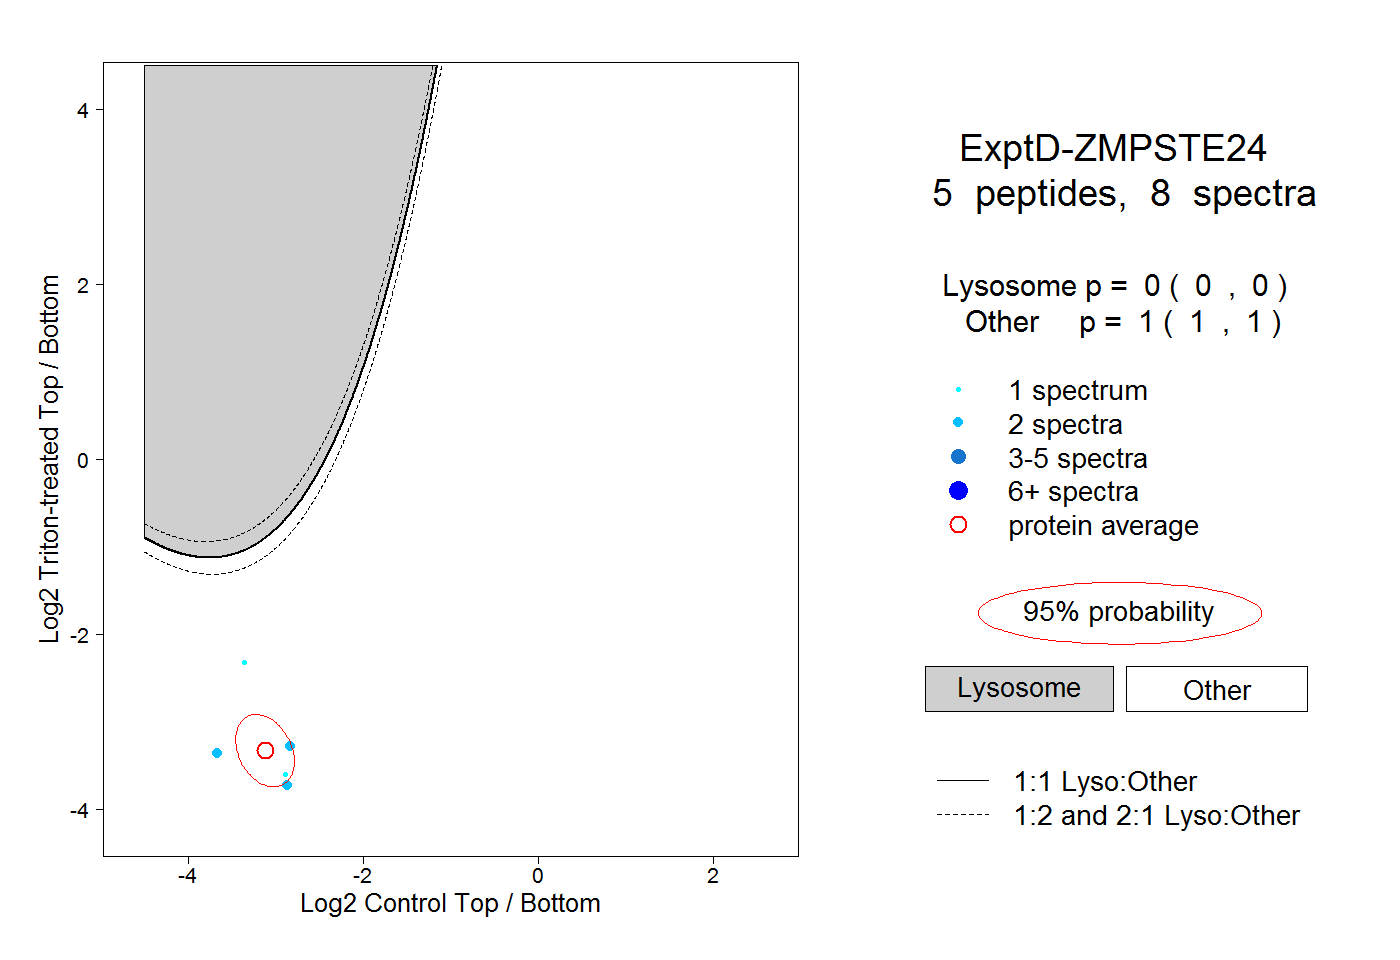 |
0.000 0.000 | 0.000 |
1.000 1.000 | 1.000 |