 14
14peptides
spectra
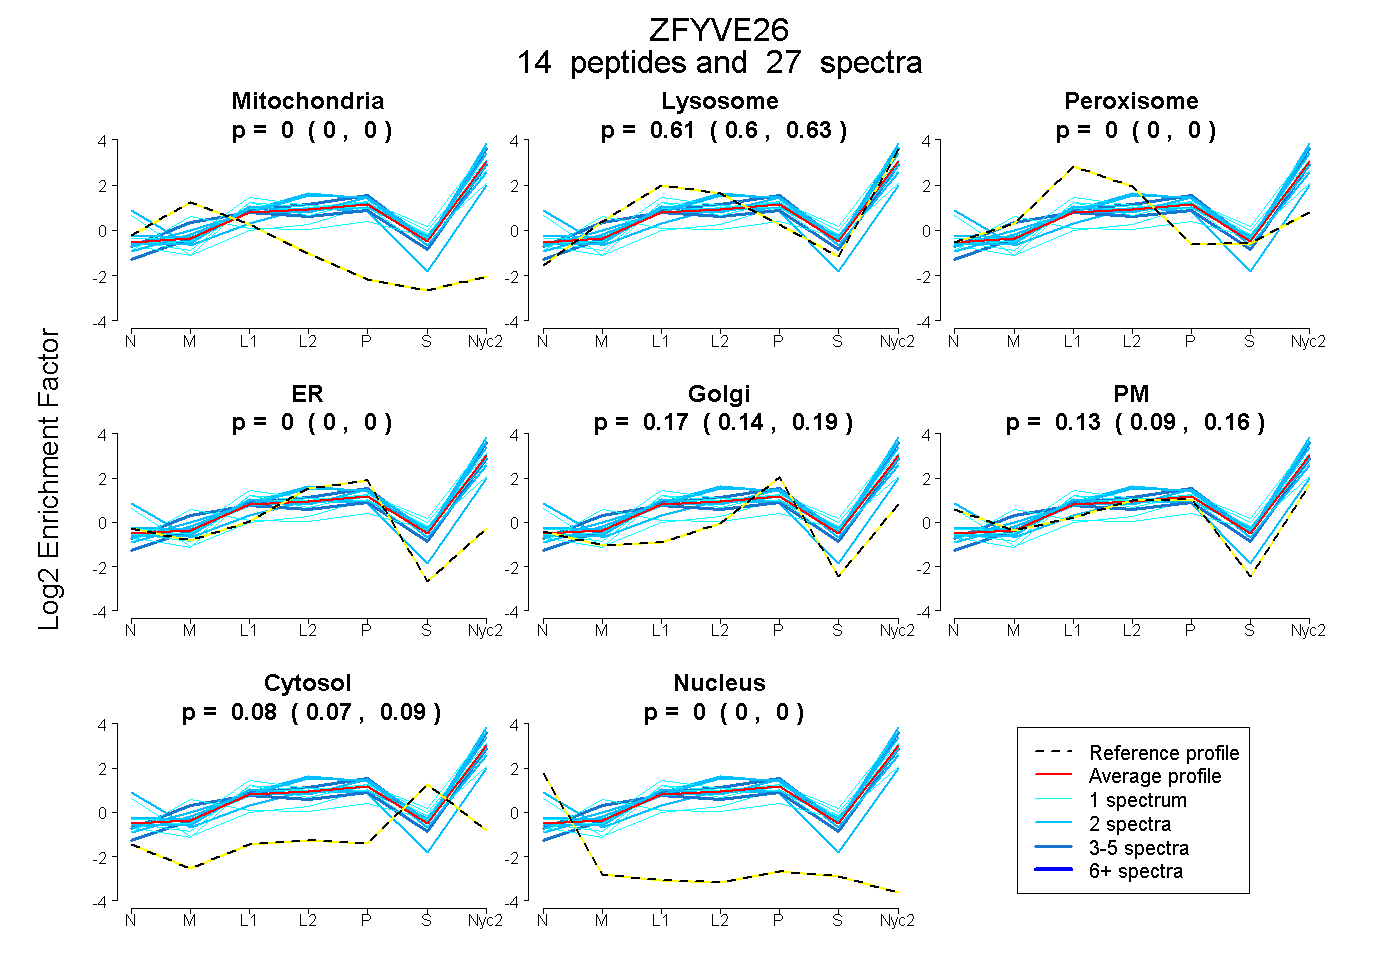
0.000 | 0.000
0.597 | 0.629
0.000 | 0.000
0.000 | 0.000
0.145 | 0.194
0.091 | 0.162
0.074 | 0.088
0.000 | 0.000
6peptides
spectra
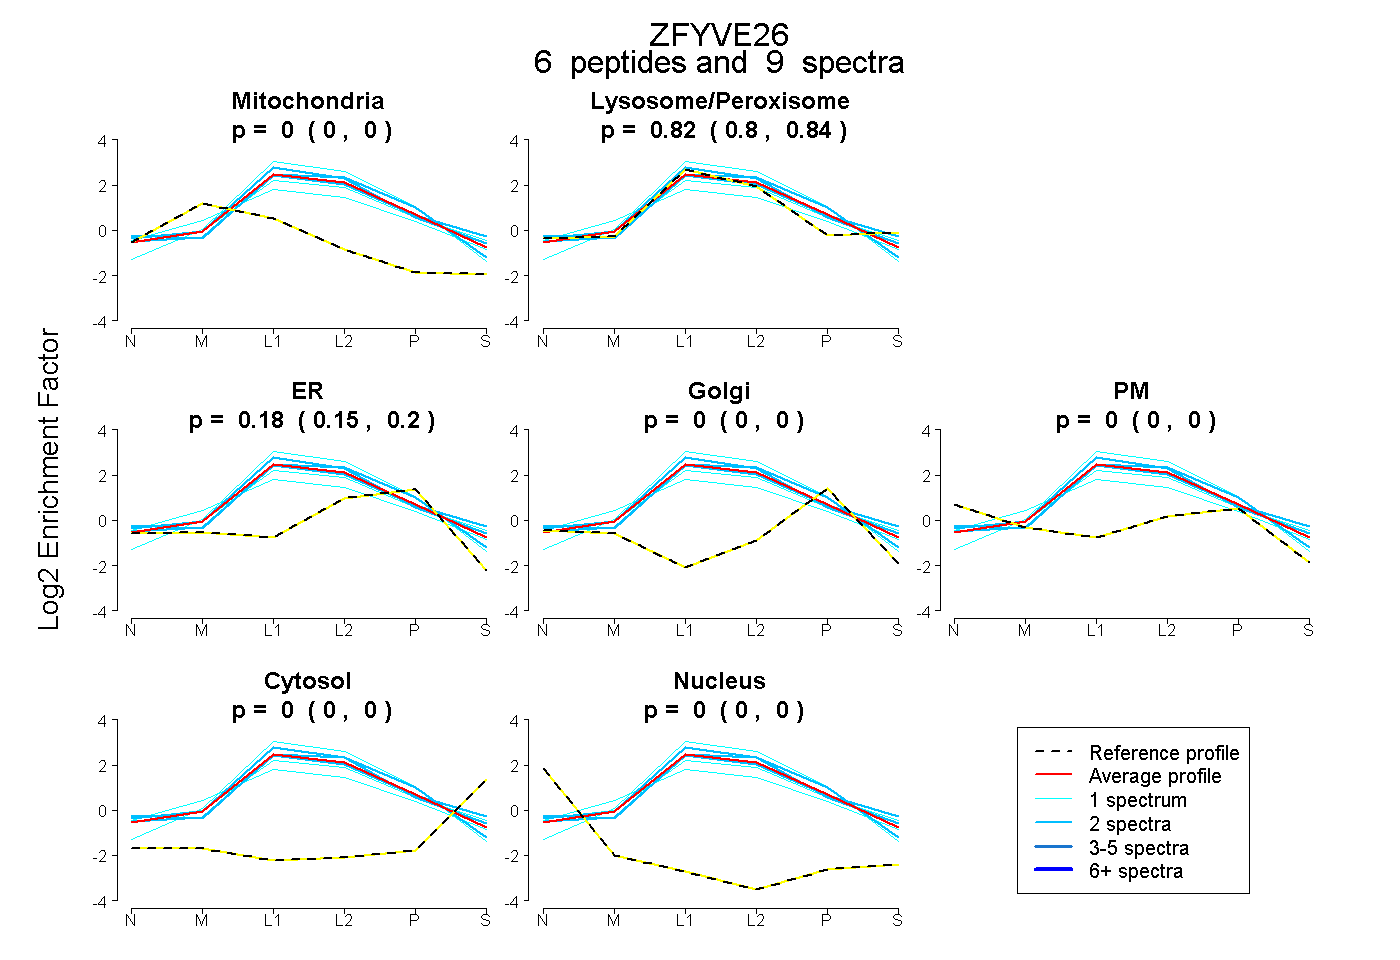
0.000 | 0.000
0.800 | 0.843
0.152 | 0.197
0.000 | 0.000
0.000 | 0.000
0.000 | 0.000
0.000 | 0.000
24peptides
spectra
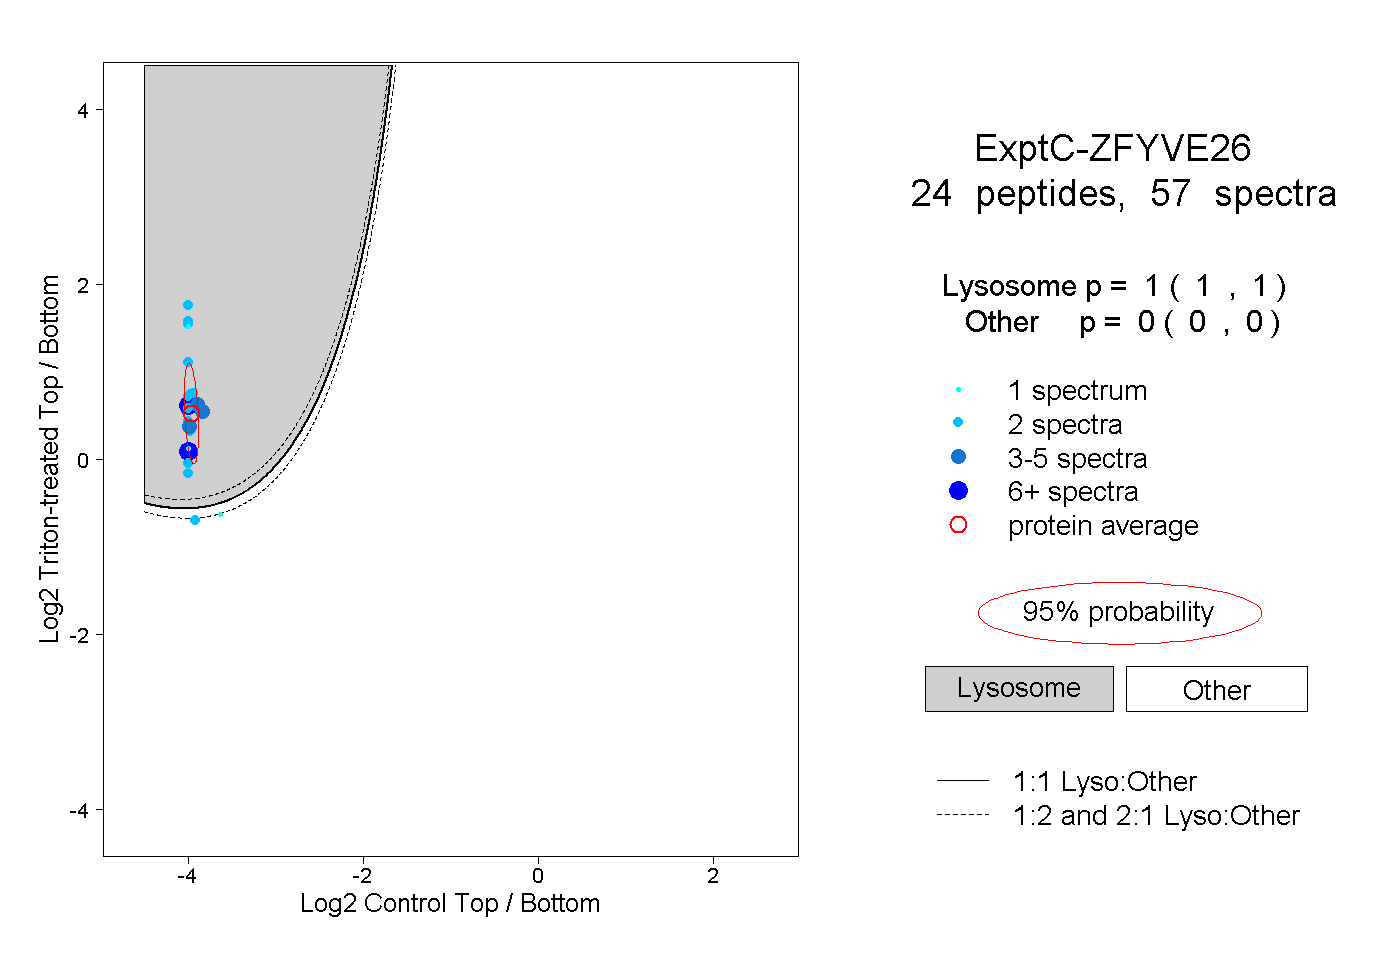
1.000 | 1.000
0.000 | 0.000
2peptides
spectra
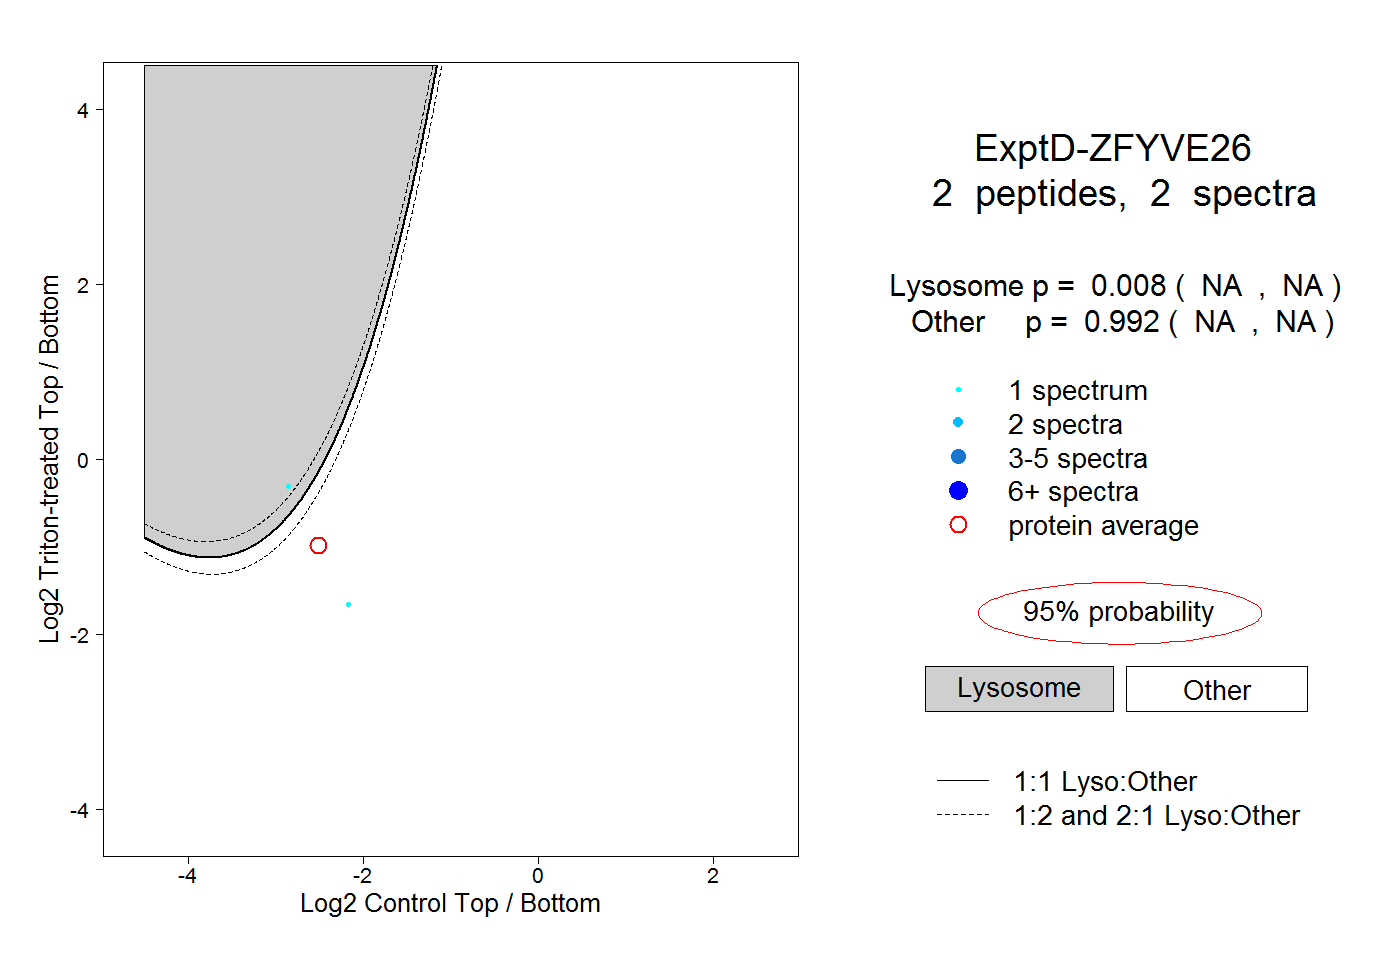
NA | NA
NA | NA