ZFYVE26
[ENSRNOP00000016380]
Main page
| | | Plot |
Mito |
Lyso |
|
Perox |
ER |
Golgi |
PM |
Cytosol |
Nucleus |
|
| Expt A |
 14
14
peptides |
27
spectra |
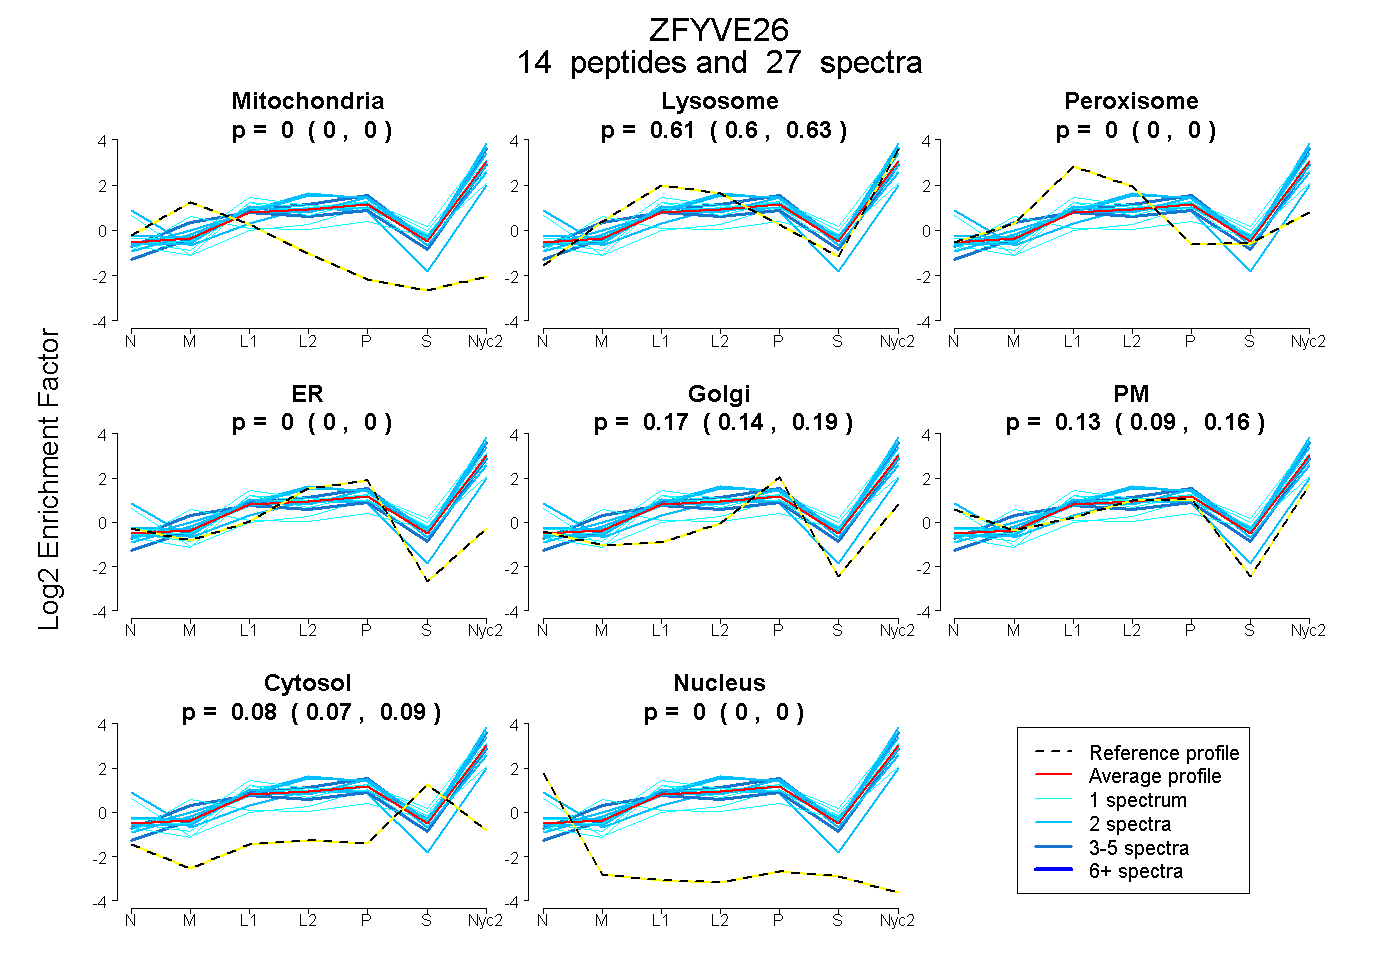 |
0.000
0.000 | 0.000 |
0.615
0.597 | 0.629 |
|
0.000
0.000 | 0.000 |
0.000
0.000 | 0.000 |
0.172
0.145 | 0.194 |
0.131
0.091 | 0.162 |
0.082
0.074 | 0.088 |
0.000
0.000 | 0.000 |
|
| | | Plot |
Mito |
|
Lyso or Perox |
|
ER |
Golgi |
PM |
Cytosol |
Nucleus |
|
| Expt B |
6
peptides |
9
spectra |
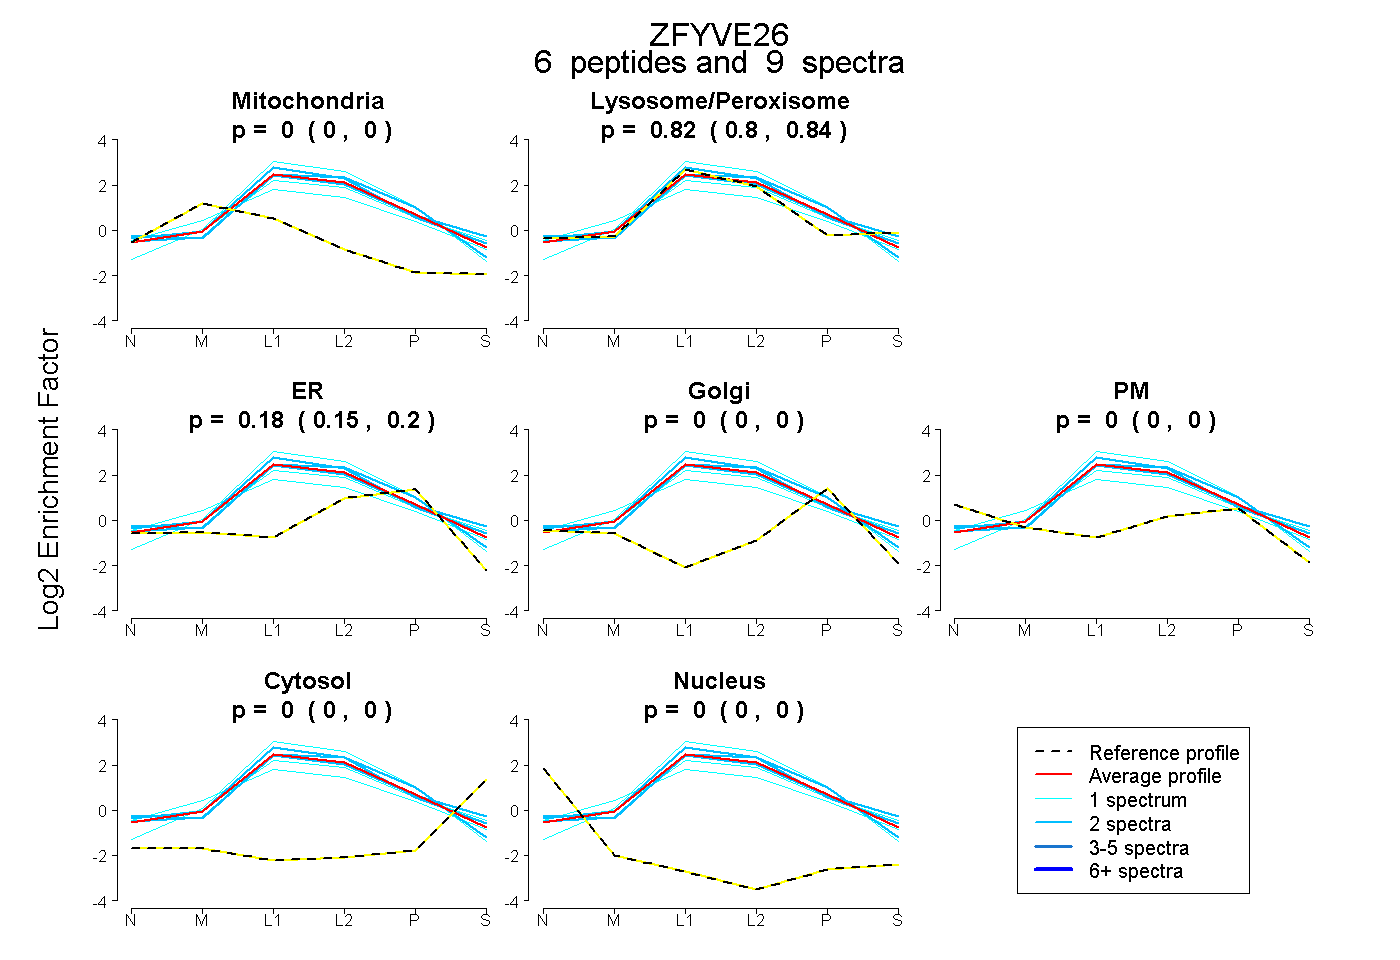 |
0.000
0.000 | 0.000 |
|
0.821
0.800 | 0.843 |
|
0.179
0.152 | 0.197 |
0.000
0.000 | 0.000 |
0.000
0.000 | 0.000 |
0.000
0.000 | 0.000 |
0.000
0.000 | 0.000 |
|
| | | Plot |
|
Lyso |
|
|
|
|
|
|
|
Other |
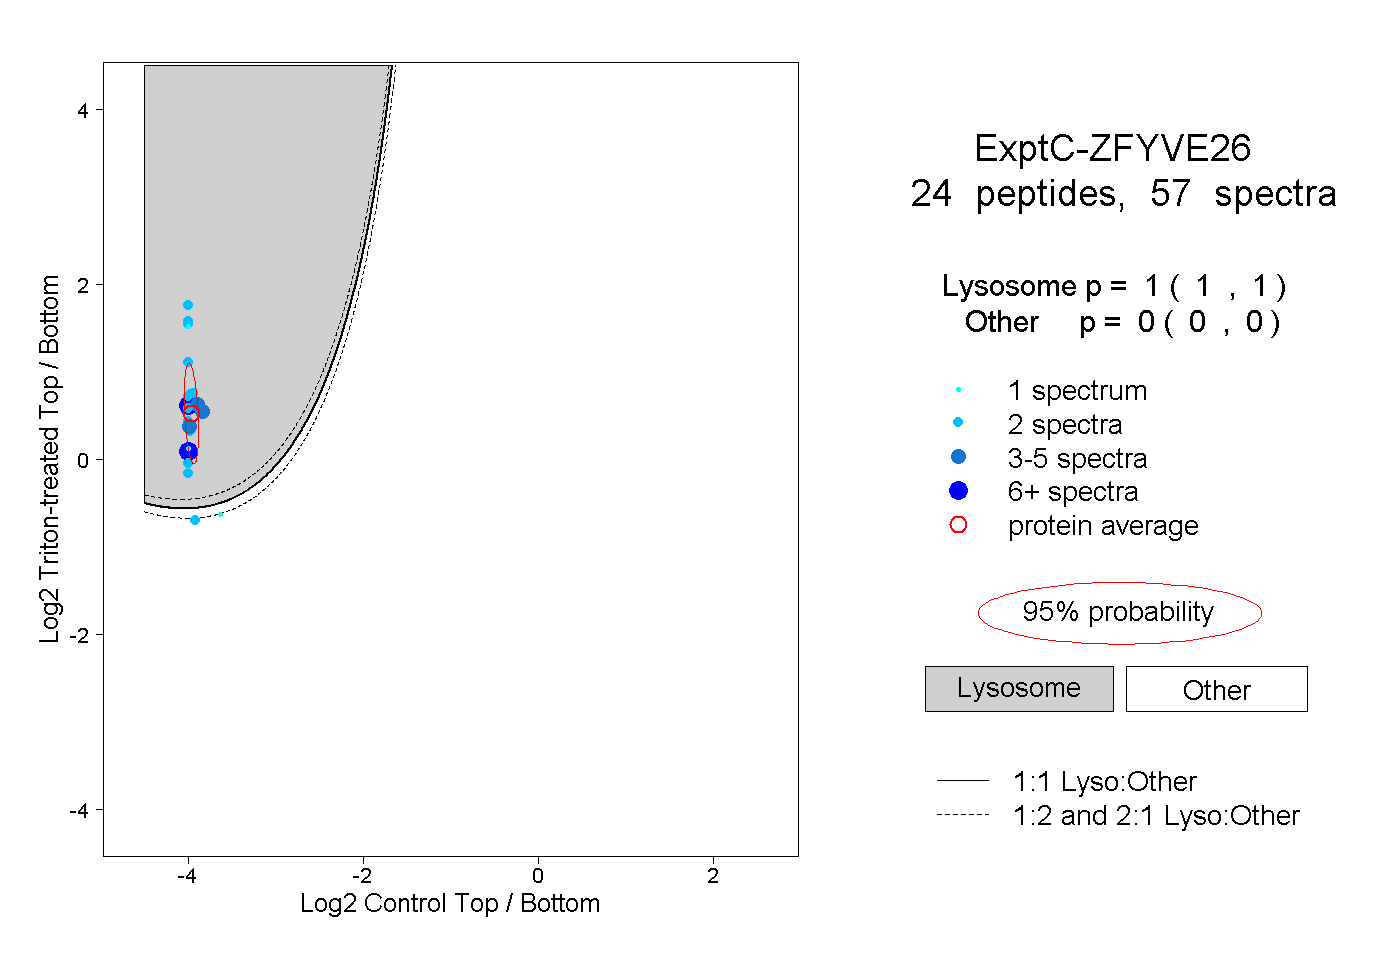
| Expt C |
24
peptides |
57
spectra |
 |
|
1.000
1.000 | 1.000 |
|
|
|
|
|
|
|
0.000
0.000 | 0.000 |
| 4 spectra, SAYLIAVK |
|
1.000 |
|
|
|
|
|
|
|
0.000 |
| 2 spectra, NESPSYSAVVR |
|
1.000 |
|
|
|
|
|
|
|
0.000 |
| 2 spectra, LLGCLLHK |
|
0.994 |
|
|
|
|
|
|
|
0.006 |
| 2 spectra, EETTTEK |
|
1.000 |
|
|
|
|
|
|
|
0.000 |
| 2 spectra, EALLHLLNK |
|
0.144 |
|
|
|
|
|
|
|
0.856 |
| 5 spectra, ELEATLR |
|
1.000 |
|
|
|
|
|
|
|
0.000 |
| 2 spectra, AYLTCCK |
|
1.000 |
|
|
|
|
|
|
|
0.000 |
| 2 spectra, SLLDLIR |
|
1.000 |
|
|
|
|
|
|
|
0.000 |
| 2 spectra, YQEVIQELAR |
|
1.000 |
|
|
|
|
|
|
|
0.000 |
| 2 spectra, YRPTAK |
|
0.999 |
|
|
|
|
|
|
|
0.001 |
| 1 spectrum, IYLQENSR |
|
1.000 |
|
|
|
|
|
|
|
0.000 |
| 1 spectrum, VLLTLPEQHR |
|
0.188 |
|
|
|
|
|
|
|
0.812 |
| 1 spectrum, VSRPSLSWK |
|
0.998 |
|
|
|
|
|
|
|
0.002 |
| 2 spectra, NQDQGHDELLR |
|
1.000 |
|
|
|
|
|
|
|
0.000 |
| 2 spectra, DLAPTGPGCPK |
|
1.000 |
|
|
|
|
|
|
|
0.000 |
| 3 spectra, ALQLLQR |
|
1.000 |
|
|
|
|
|
|
|
0.000 |
| 2 spectra, SETLEER |
|
1.000 |
|
|
|
|
|
|
|
0.000 |
| 2 spectra, QLLFSAK |
|
1.000 |
|
|
|
|
|
|
|
0.000 |
| 6 spectra, LSSSLEGR |
|
1.000 |
|
|
|
|
|
|
|
0.000 |
| 6 spectra, AGNLTAAR |
|
1.000 |
|
|
|
|
|
|
|
0.000 |
| 2 spectra, NVEDGFGIAFR |
|
1.000 |
|
|
|
|
|
|
|
0.000 |
| 1 spectrum, SLSSDPDNVEVK |
|
1.000 |
|
|
|
|
|
|
|
0.000 |
| 1 spectrum, VAERPPK |
|
1.000 |
|
|
|
|
|
|
|
0.000 |
| 2 spectra, LLSTVFR |
|
1.000 |
|
|
|
|
|
|
|
0.000 |
| | | Plot |
|
Lyso |
|
|
|
|
|
|
|
Other |
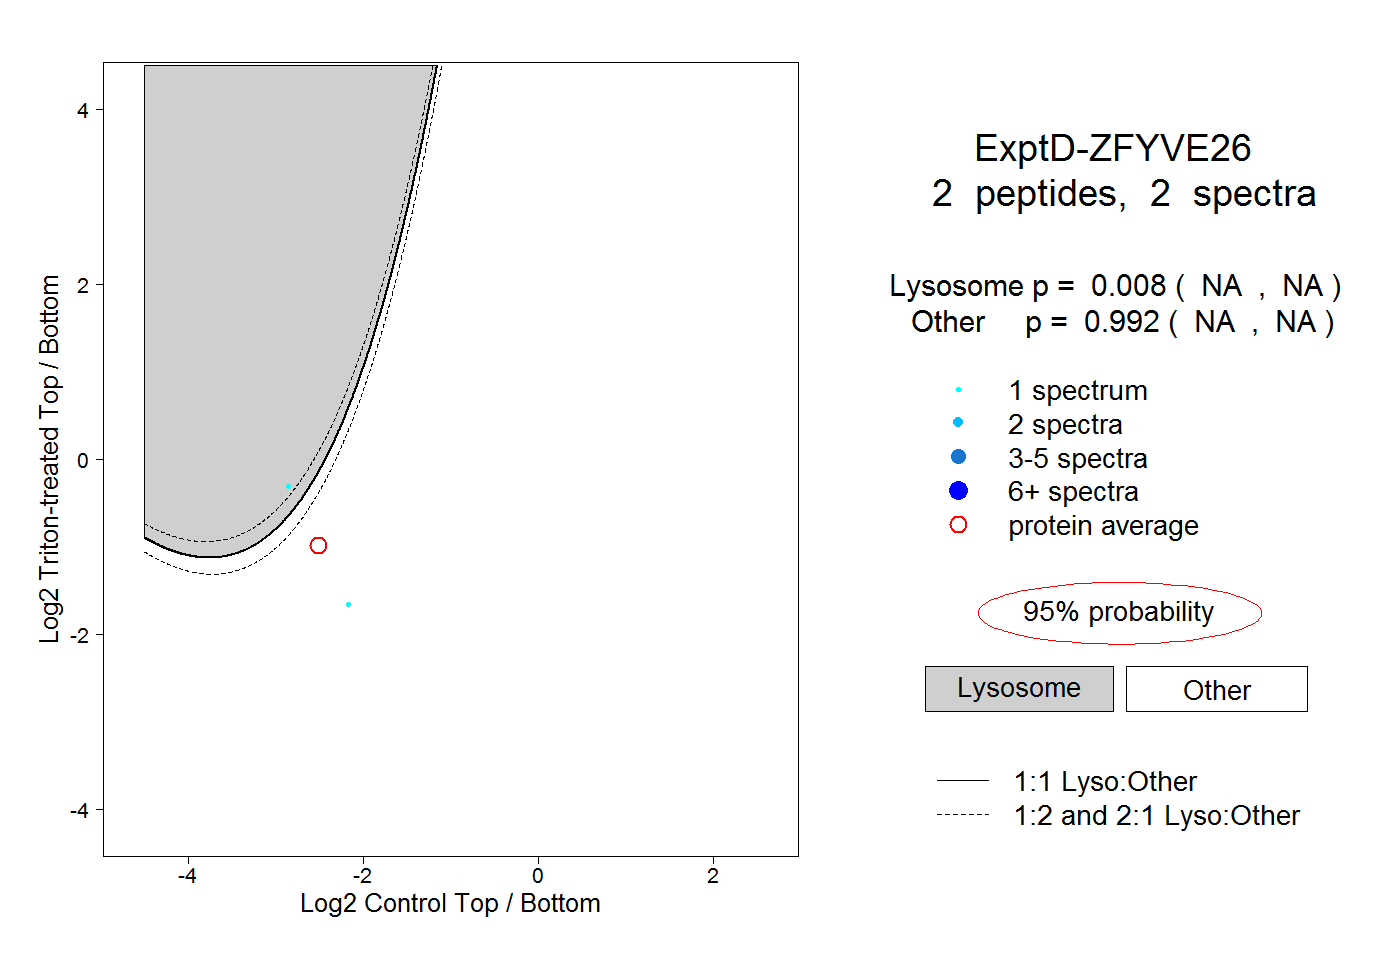
| Expt D |
2
peptides |
2
spectra |
 |
|
0.008
NA | NA |
|
|
|
|
|
|
|
0.992
NA | NA |